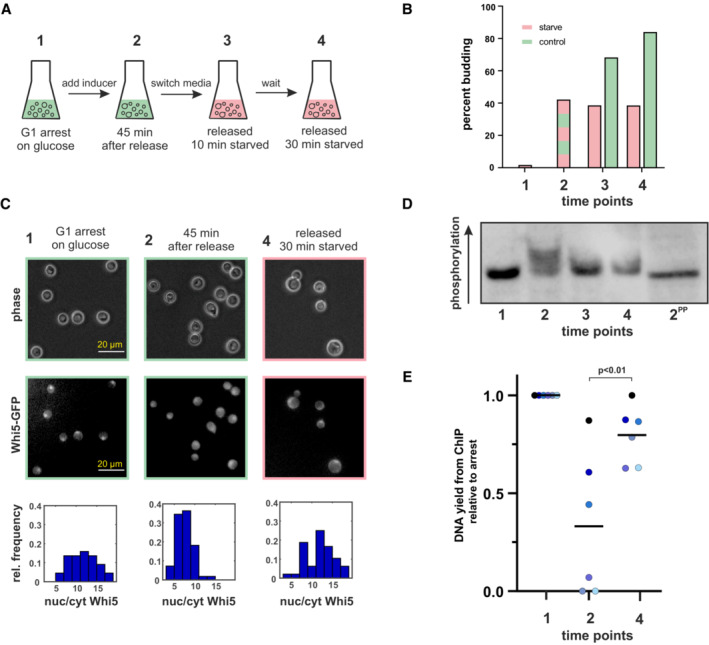
Figure 6. Whi5 phosphorylation and DNA binding during starvation.

- Schematic of the experimental set‐up.
- Budding index of the cultures at the indicated time points. The green bars at t3 and t4 indicate control cultures that remained in glucose medium after 45 min.
- At the indicated time points samples from the cultures harboring Whi5‐GFP were imaged and the nuclear/cytoplasmic GFP concentration determined for 50 cells each. Bottom row depicts the resulting histogram (see also Fig EV2B for overlay), the upper rows show example images. Scale bar = 20 μm.
- Phos‐tag‐SDS–PAGE Western blot of Whi5‐V5. Numbers indicate the sampling time points shown in (A). 2PP indicates sample 2 (cells growing on glucose, 45 min after a G1 release) treated with phosphatase. See Fig EV2C for a blot from a replicate experiment.
- Cells from the experiment described in (A) were fixed at the indicated time points and chromatin‐immunoprecipitation with Whi5‐Flag as bait was performed. The graph reports the total DNA yield (normalized to t1) for six independent experiments. Black bars indicate the mean of the six replicates. P‐value based on a paired t‐test. The amount of Whi5 pulled down in the IP was similar across time points (Fig EV2E).
