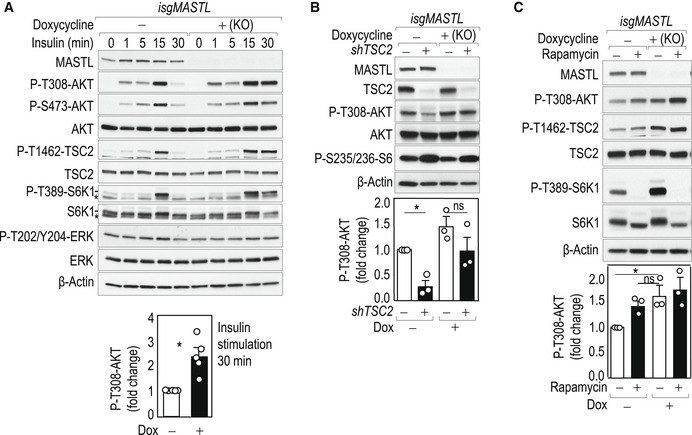
Figure 2. MASTL controls AKT phosphorylation in response to insulin signaling.

- Time‐course experiment at the indicated time points after 100 nM insulin stimulation in 6 h serum‐starved control and MASTL knockout MDA‐MB‐231 cells using the isgMASTL system. The plot shows the quantification of phospho‐AKT T308 after 30 min of insulin stimulation. Plots display mean data + SEM from five independent experiments. *P < 0.05, Student's t‐test.
- TSC2 was knocked down in control or MASTL‐null MDA‐MB‐231 cells using specific (+) or scrambled (−) shRNAs. Cells were starved for glucose for 1 h. The plot shows the quantification of phospho‐AKT T308. Data are mean + SEM from three independent experiments. ns, not significant; *P < 0.05, One‐way ANOVA.
- MDA‐MB‐231 control (−) or MASTL‐null (+) cells were treated with 100 nM rapamycin or vehicle as control. Cells were starved for glucose for 1 h and re‐stimulated with glucose for 15 min; rapamycin was added 15 min before glucose stimulation. The plot shows the quantification of phospho‐AKT T308. Data are mean + SEM from three independent experiments. ns, not significant; *P < 0.05, one‐way ANOVA.
