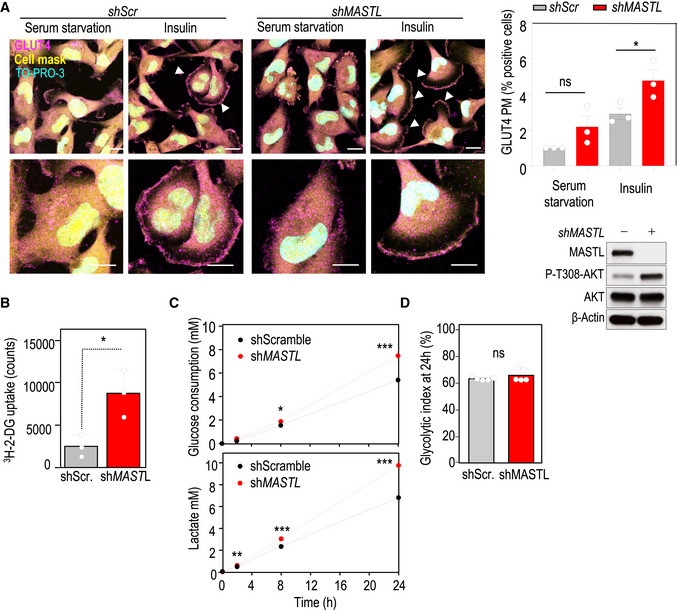
Immunofluorescence for GLUT4 (magenta) in MDA‐MB‐231 cells in conditions of serum starvation and insulin stimulation. TO‐PRO‐3 (DNA) is in cyan and a cell mask is in yellow. Arrowheads indicate positive cells for GLUT4 enrichment at the plasma membrane (PM). Representative magnifications are also shown. Scale bars, 10 μm. The plot shows the quantification of the percentage of cells positive for GLUT4 translocation at the PM. Data are mean fold increase versus serum deprivation in scramble condition ± SEM from three independent experiments. ns, not significant; *P < 0.05, one‐way ANOVA. Control immunoblotting in conditions of insulin stimulation is also shown for the indicated antibodies.
Cells were treated with specific shRNAs against MASTL (+) or scrambled shRNAs (−), and then serum starved before incubation with 2‐deoxy‐D‐[1‐3H]‐glucose. Bars show mean glucose uptake + SEM of three independent experiments. *P < 0.05, Student's t‐test.
Control (shScr.) and MASTL‐depleted (shMASTL) HepG2 cells were incubated with 10 mM glucose and metabolites in the media were quantified by NMR at the indicated time points. The time course of glucose consumption (upper panel) and lactate production (lower panel) in cell media are indicated. Data are mean ± SD of five independent plates. *P < 0.05; **P < 0.01, ***P < 0.001, unpaired Student's t‐test.
Glycolytic index at 24 h comparing control and MASTL‐depleted cells treated as in C calculated as −0.5 × ([Lac]/([Glc]0 − [Glc]). Data are mean ± SD of five independent plates. ns, not significant, unpaired Student's t‐test.

