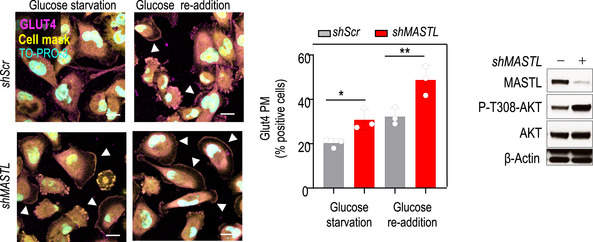
Figure EV3. Effect of MASTL depletion on cellular metabolism.

MASTL was knocked down using shRNAs for MASTL (+) and scramble shRNA (−) as a control in MDA‐MB‐231 cells, and immunofluorescence for GLUT4 (magenta) in conditions of glucose starvation and re‐addition was performed. TO‐PRO‐3 (DNA) is in cyan and a cell mask is in yellow. Arrowheads indicate positive cells for GLUT4 enrichment at the plasma membrane (PM). Scale bars, 10 μm. The graph shows the quantification of the percentage of cells positive for GLUT4 at the PM. The bar chart displays mean data ± SEM from thee independent experiments. Significance was determined by one‐way ANOVA (*P < 0.05; **P < 0.01). Control immunoblotting is shown in conditions of glucose re‐addition for the indicated antibodies.
