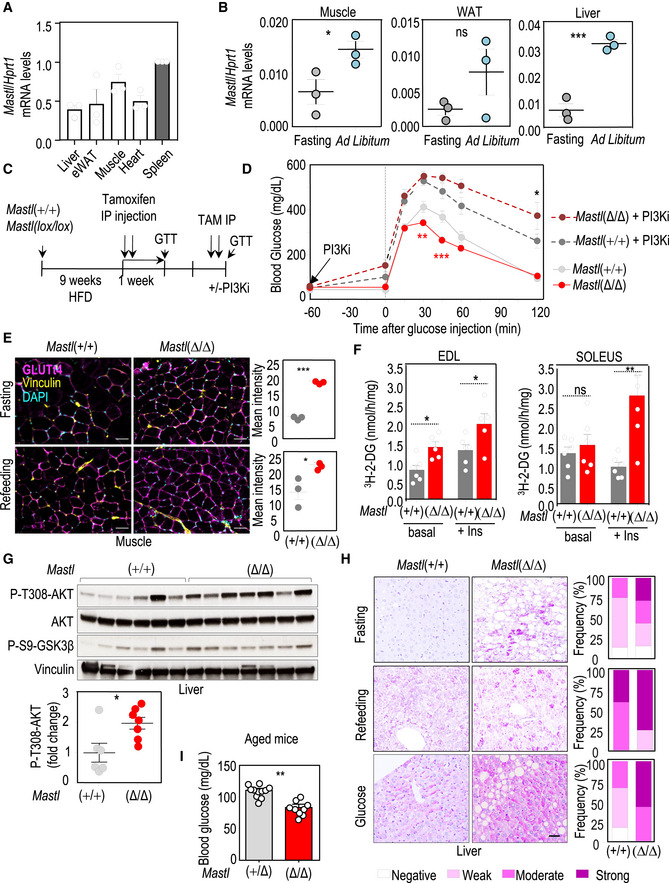
RT–qPCR analysis of Mastl transcripts in different tissues from ad libitum mice. The graph represents the average + SEM of normalized Mastl mRNA level from three mice. Hprt1 was used as a housekeeping gene to normalize the Mastl expression level in each tissue.
Relative levels of Mastl transcripts (normalized to Hprt mRNA levels) in muscle, epididymal white adipose tissue (WAT) and liver from wild‐type mice after fasting for 16 h or fed ad libitum. Data are mean ± SEM; ns, not significant; *P < 0.05; ***P < 0.001, Student's t‐test.
Schematic representation of the protocol followed for the glucose tolerance test (GTT).
Glucose tolerance test in
Mastl(+/+) (
n = 6) and
Mastl(Δ/Δ) (
n = 11) mice. Eight‐ to twelve‐week‐old male mice were fed high‐fat diet (HFD; 60% fat) for 9 weeks before being treated with tamoxifen to induce Mastl deletion. Treatment of
Mastl(+/+) (
n = 5) and
Mastl(Δ/Δ) (
n = 10) mice with the PI3K inhibitor
ETP46992 (PI3Ki) was performed 1 h before glucose injection. Data are mean ± SEM; *
P < 0.05; **
P < 0.01; ***
P < 0.001; two‐way ANOVA.
GLUT4 staining (magenta) in skeletal muscle sections. Vinculin (membrane) and DAPI (DNA) staining are shown in yellow and cyan, respectively. Scale bars, 50 μm. Mice were fasted overnight for 16 h, and re‐fed for 2 h before sample collection. Quantification of the mean intensity [relative units ×103; n = 3 Mastl(+/+) and 3 Mastl(Δ/Δ)] is shown. Data points reflect the mean ± SEM; *P < 0.05; ***P < 0.001; unpaired Student's t‐test.
Ex vivo glucose uptake in EDL and soleus muscles from Mastl(+/+) (n = 6) and Mastl(Δ/Δ) (n = 5) mice, in basal conditions and upon insulin stimulation (100 nM, 20 min). Mice were fasted overnight before muscle isolation, and data were normalized to muscle weight. Plots show the mean + SEM; ns, not significant; *P < 0.05; **P < 0.01; unpaired Student's t‐test.
Immunoblot with the indicated antibodies in liver tissues from Mastl(+/+) (n = 6) and Mastl(Δ/Δ) (n = 7) mice. Mice were fasted overnight for 16 h, injected intraperitoneally with glucose (2 g/kg body), and sacrificed 30 min later for sample collection. Quantification of the relative fold change signal of phospho‐AKT T308 (normalized to total AKT level). n = 6 Mastl(+/+) and 7 Mastl(Δ/Δ) mice. Charts reflect the mean ± SEM; *P < 0.05; unpaired Student's t‐test.
Representative images of periodic acid–Schiff (PAS) staining in liver sections from Mastl(+/+) and Mastl(Δ/Δ) mice. Scale bars, 20 μm. Mice were fasted overnight for 16 h, injected intraperitoneally with glucose (2 g/kg body), or re‐fed for 2 h, and sacrificed 30 min later for sample collection. Bars show the relative frequency of PAS staining intensity (n = 3 mice/genotype). Chi‐square test (***P < 0.001 in all conditions).
Blood glucose levels in ad libitum Mastl(Δ/Δ) (n = 12) and Mastl(+/Δ) (n = 11) mice. Mice were treated with tamoxifen diet to induce Mastl depletion, and blood glucose concentration was determined 1 month later in the morning of ad libitum‐fed mice. Data are mean + SEM; **P < 0.01, unpaired Student's t‐test.

