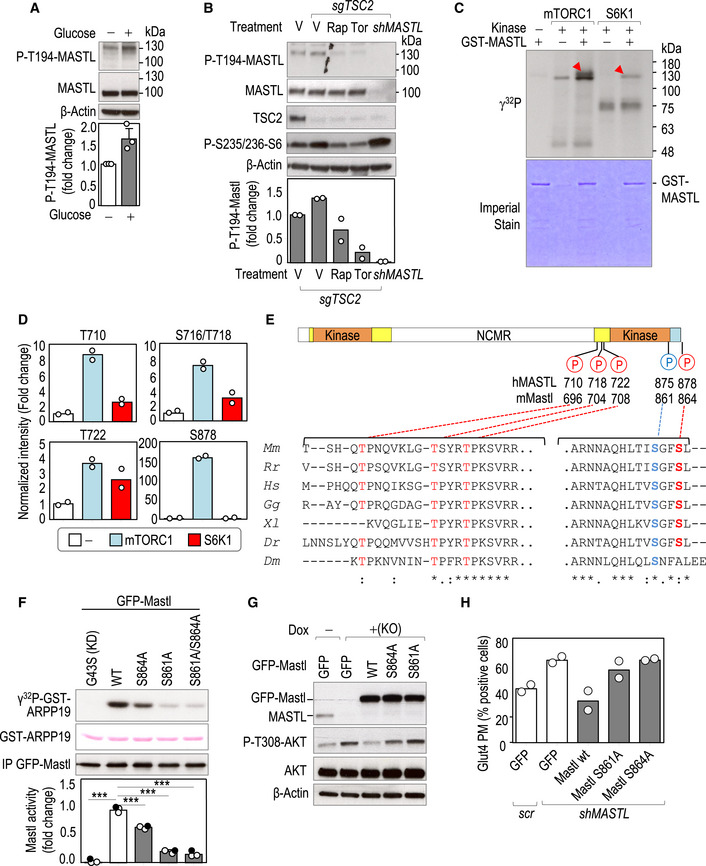
MDA‐MB‐231 cells were starved for 1 h and re‐stimulated with glucose for 15 min and T194 phosphorylation was tested with a specific antibody. The plot shows the quantification of phospho‐MASTL T194. Data are mean + SEM from three independent experiments. ns, not significant; Student's t‐test.
Cas9‐expressing control (−) cells or cells with CRIPSR/Cas9‐mediated TSC2 knockout (sgTSC2) were treated with rapamycin (Rap), Torin1 (Tor), or vehicle as control (V). MASTL‐knockdown cells (shMASTL) were used as an additional control of the specificity of the antibody. Inhibitors were added 15 min before glucose re‐stimulation for an additional 15 min and total cell lysates were harvested for immunoblot. The plot shows the quantification of phospho‐MASTL T194 as a mean from two independent experiments.
In vitro kinase assay using purified GST‐human MASTL as a substrate, and recombinant mTORC1 and S6K1 kinases. Red arrowheads show the phosphorylation of MASTL in the presence of mTORC1 or S6K1. Note the appearance of other phosphorylation signals in mTORC1 and S6K1 reactions, independently of the presence of MASTL, which correspond to autophosphorylation of these kinases. Imperial staining shows the amount of GST‐MASTL protein used as a substrate in each reaction.
Mass spectrometry analysis of samples treated as in panel (C). The plots represent the intensity of mTORC1‐S6K1‐regulated phosphosites on human MASTL. Data (mean and individual values from two technical replicates) were normalized to the total levels of MASTL and plotted as relative values to the condition of MASTL alone.
Schematic representation of MASTL protein structure showing the potential mTORC1/S6K phosphorylation sites (red color) identified in the in vitro kinase assay shown in (C). The autophosphorylation residue previously reported to be required for MASTL activity is shown in blue. Orange boxes indicate the conserved kinase domains. Yellow boxes indicate additional sequences conserved in Mastl in different species. The C‐tail domain is shown in blue. The alignment of the amino acid sequence regions surrounding those phosphosites across different species is shown below. Mm, Mus musculus; Rr, Rattus rattus; Hs, Homo sapiens; Gg, Gallus gallus; Xl, Xenopus laevis; Dr, Danio rerio; Dm, Drosophila melanogaster.
In vitro kinase activity of Mastl mutant isoforms. HEK‐293T cells were transiently transfected with the indicated GFP fusions of mouse Mastl mutants. Anti‐GFP immunocomplexes were subjected to a kinase reaction using recombinant ARPP19 (white circles) or ENSA (filled circles) as a substrate. The graph shows the relative catalytic activity of the indicated mutants. The kinase activity of GFP‐mMastl wild‐type was set as 1 (n = 3 independent experiments). Data are mean + SEM from three independent experiments. ***P < 0.001; one‐way ANOVA.
isgMASTL MDA‐MB‐231 cells were transduced with the indicated Mastl mutants or GFP alone as a control and treated with doxycycline (Dox) to induce Mastl deletion. Cells were collected after glucose stimulation, and total lysates were blotted for the indicated antibodies.
MDA‐MB‐231 cells were transduced with the indicated Mastl mutants or GFP alone as a control, and infected with scramble or shMASTL to deplete endogenous MASTL. Cells were fixed upon insulin stimulation for GLUT4 staining. Quantification of the percentage of cells positive for GLUT4 at the plasma membrane in each condition is shown. Data show the mean and individual values from two independent experiments.

