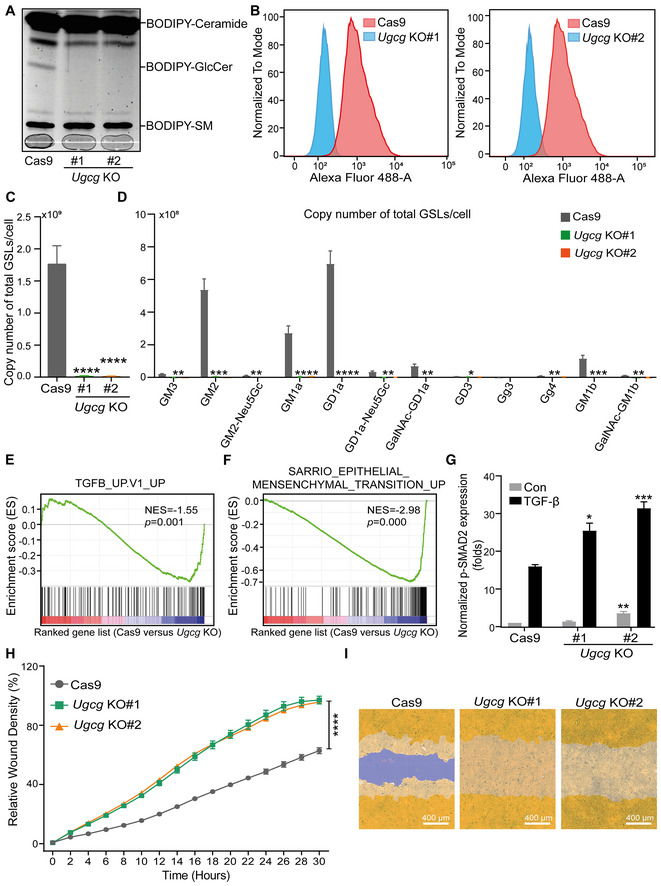
Figure EV1. related to Fig 2. KO of Ugcg promotes TGF‐β signaling, EMT and migration of NMuMG cells.

- Analysis of BODIPY‐conjugated ceramide, GlcCer, and sphingomyelin (SM) in two independent Ugcg KO NMuMG cell lines and the control NMuMG cell line using TLC. The light gray line at the bottom of the gel (that is marked with a pencil) was used to indicate the running lanes during the experiment (and where the samples were loaded).
- Detection of GM1 ganglioside by flow cytometry using Alexa Fluor 488‐conjugated CTB in two Ugcg KO (KO#1 and KO#2) NMuMG cell lines infected with one guide RNA and a Cas9 expression vector or with a Cas9 expression vector alone (control).
- Average absolute quantities of total GSL‐glycans per cell in NMuMG cells with Ugcg KO.
- Average absolute quantities of individual GSL‐glycans per cell in NMuMG cells with Ugcg KO.
- The human TGF‐β gene response signature was enriched in Cas9 control versus Ugcg KO NMuMG cells, as shown by GSEA. NES = −1.55, P = 0.001.
- GSEA of the human EMT gene signature enriched in Cas9 control versus Ugcg KO NMuMG cells. NES = −2.98, P = 0.000.
- Quantification of the p‐SMAD2 level in NMuMG cells, including the Cas9 group and the Ugcg KO groups with and without TGF‐β (2.5 ng/ml) treatment for 1 h. Tubulin: loading control.
- The time course of wound closure in NMuMG cells with or without Ugcg deficiency was analyzed by an IncuCyte system.
- Representative images of a scratch wound at the final time point (30 h) in the control group and two Ugcg KO groups of NMuMG cells. The region of the original scratch is indicated in purple, and the region of the cell is colored yellow. Scale bar = 400 μm.
Data information: All data are expressed as the mean ± SD values from three biological replicates (n = 3). *P ≤ 0.05; **P < 0.01; ***P < 0.001; ****P < 0.0001. In (C, D, G), statistical analysis was based on unpaired Student's t‐test. In (H), statistical analysis was based on two‐way ANOVA.
Source data are available online for this figure.
