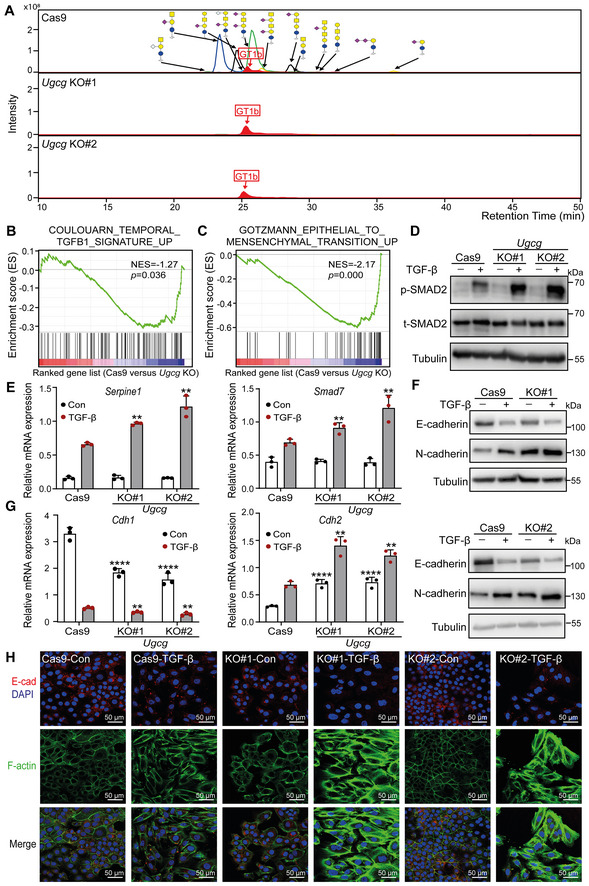
Figure 2. KO of Ugcg, a key enzyme in the biosynthesis of GSLs, promotes TGF‐β signaling and TGF‐β‐induced EMT in NMuMG cells.

- Combined extracted ion chromatography of GSL glycans in Ugcg KO and control NMuMG cells. GT1b: internal normalization control.
- Mouse TGF‐β gene signatures were enriched in Cas9 control versus Ugcg KO NMuMG cells, as shown by GSEA. Normalized enrichment score (NES) = −1.27, P = 0.036.
- GSEA of mouse EMT gene signatures in Cas9 control versus Ugcg KO NMuMG cells. NES = −2.17, P = 0.000.
- Immunoblot analysis of p‐SMAD2 and total SMAD2 (t‐SMAD2) in NMuMG cells with or without Ugcg deficiency and treated with vehicle control or TGF‐β for 1 h. Tubulin: loading control.
- qRT–PCR analysis of TGF‐β target genes, including Serpine1 and Smad7, in Ugcg KO NMuMG or control NMuMG cells treated with vehicle control or TGF‐β for 6 h.
- Immunoblot analysis of E‐cadherin and N‐cadherin in Ugcg KO NMuMG or control NMuMG cells treated with vehicle control or TGF‐β for 48 h. Tubulin: loading control.
- Cdh1 and Cdh2 mRNA levels in Ugcg KO or control NMuMG cells after vehicle control or TGF‐β treatment for 48 h.
- Immunofluorescence analysis of the expression and localization of E‐cadherin (red) and the formation of F‐actin (green) after treatment with vehicle control or TGF‐β for 2 days. Nuclei were counterstained with DAPI (blue). Images were acquired with confocal microscopy. Scale bar = 50 μm.
Data information: TGF‐β was applied at a final concentration of 2.5 ng/ml. In (E, G), the data are expressed as the mean ± SD values from three biological replicates (n = 3). **P < 0.01; ****P < 0.0001 based on unpaired Student's t‐test.
