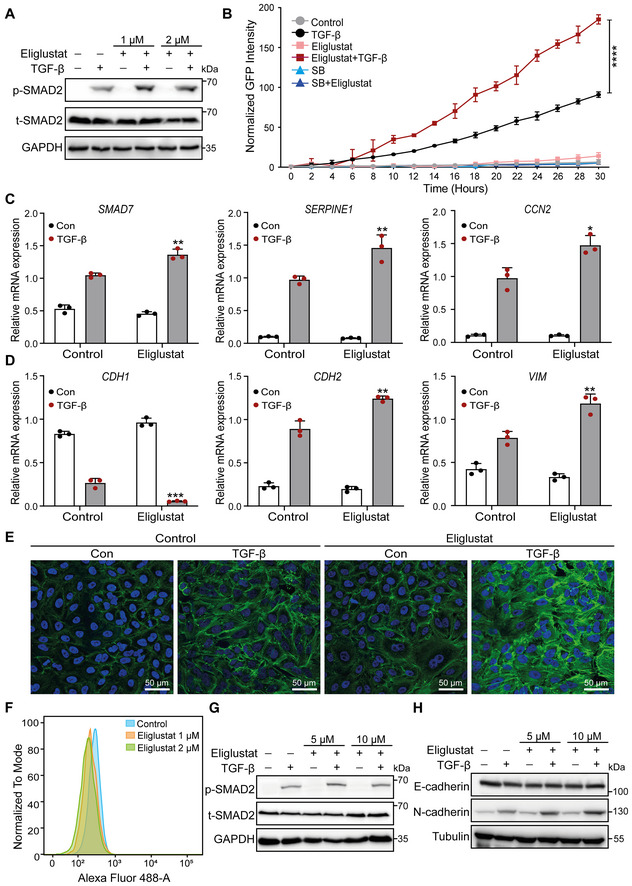
Figure EV2. related to Fig 3. Treatment with the UGCG inhibitor eliglustat promotes TGF‐β signaling and TGF‐β‐induced EMT.

- Levels of p‐SMAD2 and t‐SMAD2 in A549‐VIM‐RFP cells pretreated with eliglustat (1 or 2 μM) for 4 days and then treated with TGF‐β or vehicle control for another 2 days, as shown by immunoblot analysis. GAPDH: loading control.
- Effect of eliglustat (2 μM) (pre)treatment for 4 days on SMAD3/SMAD4‐dependent (CAGA)12‐mediated transcriptional GFP reporter expression levels in A549‐VIM‐RFP cells transduced with the CAGA‐GFP lentiviral vector and treated with TGF‐β and/or SB505124 (SB, 1 μM) for the indicated times. The time course of the GFP signal was monitored with an IncuCyte system. The GFP object intensity was normalized to the green intensity at 0 h.
- qRT–PCR analysis of TGF‐β target genes, including SMAD7, SERPINE1 and CCN2, in A549‐VIM‐RFP cells pretreated with eliglustat (2 μM) for 6 days and then treated with vehicle control or TGF‐β for 6 h.
- CDH1, CDH2, and VIM mRNA levels in A549‐VIM‐RFP cells pretreated with eliglustat (2 μM) for 6 days and then treated with vehicle control or TGF‐β for 6 h.
- Alexa Fluor 488 phalloidin staining of F‐actin (green) in A549‐VIM‐RFP cells pretreated with eliglustat (2 μM) for 4 days and then treated with vehicle control or TGF‐β for 48 h. Nuclei were counterstained with DAPI (blue). Images were acquired with confocal microscopy. Scale bar = 50 μm.
- Detection of GM1 ganglioside expression in NMuMG cells upon treatment with eliglustat (1 or 2 μM) for 4 days, as analyzed by flow cytometry using Alexa Fluor 488‐conjugated CTB.
- Immunoblot analysis of p‐SMAD2 and t‐SMAD2 in NMuMG cells treated with eliglustat (5 or 10 μM) for 4 days and with vehicle control and/or TGF‐β for 1 h. GAPDH: loading control.
- Western blot analysis of the expression of the epithelial marker E‐cadherin and mesenchymal marker N‐cadherin in NMuMG cells (pre) treated with eliglustat (5 or 10 μM) for 4 days and with vehicle control and/or TGF‐β for 2 days. Tubulin: loading control.
Data information: TGF‐β was applied at a final concentration of 2.5 ng/ml. All data are expressed as the means ± SD values from three biological replicates (n = 3). *P ≤ 0.05; **P < 0.01; ***P < 0.001; ****P < 0.0001. In (B), statistical analysis was based on two‐way ANOVA. In (C, D), statistical analysis was based on unpaired Student's t‐test.
