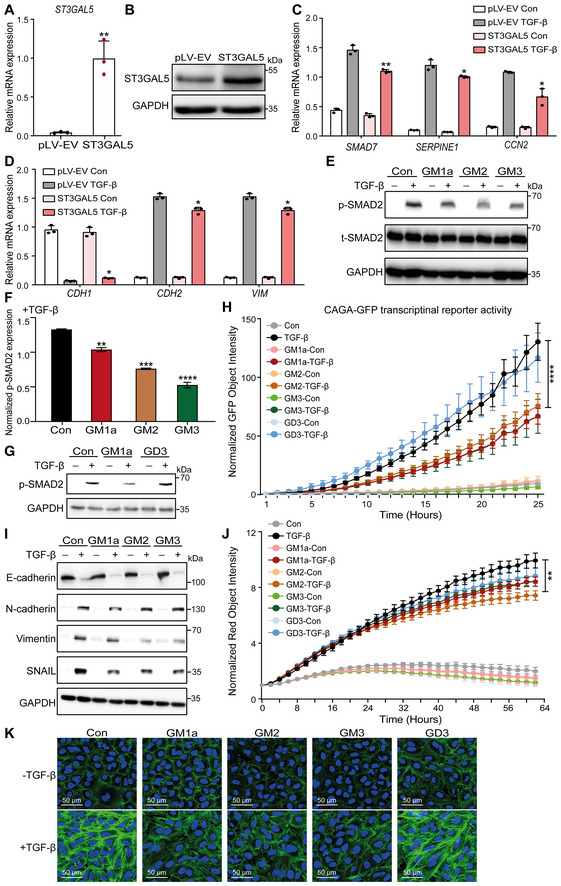
Figure EV3. related to Fig 5. ST3GAL5 and its downstream products GM3, GM2, and GM1a inhibit TGF‐β signaling and TGF‐β‐induced EMT.

- qRT–PCR analysis of ST3GAL5 in A549‐VIM‐RFP cells lentivirally transduced with the pLV‐EV control or ST3GAL5 expression construct.
- Immunoblot analysis of ST3GAL5 expression in A549‐VIM‐RFP cells transduced with the pLV‐EV or ST3GAL5 expression construct. GAPDH, loading control.
- qRT–PCR analysis of TGF‐β target genes, including SMAD7, SERPINE1 and CCN2, in A549‐VIM‐RFP cells transduced with the pLV‐EV control or ST3GAL5 expression construct and treated with vehicle control or TGF‐β for 6 h.
- CDH1, CDH2 and VIM mRNA levels in A549‐VIM‐RFP cells transduced with or without the ST3GAL5 expression construct and treated with vehicle control or TGF‐β for 2 days.
- A549‐VIM‐RFP cells were preincubated with 50 μg/ml GM1a, GM2, or GM3 for 24 h and were then treated with vehicle control or TGF‐β for 1 h. Immunoblot analysis of p‐SMAD2 and t‐SMAD2 was then performed. GAPDH: loading control.
- Quantification of the p‐SMAD2 level in A549‐VIM‐RFP cells treated with 50 μg/ml GM1a, GM2, or GM3 in combination with TGF‐β (results shown in E).
- A549‐VIM‐RFP cells were pretreated with 50 μg/ml GM1a or GD3 for 24 h and were then treated with vehicle control or TGF‐β for 1 h. The levels of p‐SMAD2 were measured by western blotting. GAPDH: loading control.
- A549‐VIM‐RFP cells transduced with the CAGA‐GFP lentiviral vector were pretreated with 50 μg/ml GM1a, GM2, GM3 or GD3 for 24 h and were then treated with vehicle control or TGF‐β for the indicated times. SMAD3/SMAD4‐dependent (CAGA)12‐mediated transcriptional GFP reporter expression levels were monitored with an IncuCyte system. The GFP object intensity was normalized to the green intensity at 0 h.
- The expression levels of the epithelial marker E‐cadherin and mesenchymal markers, including N‐cadherin, vimentin, and SNAIL, in A549‐VIM‐RFP cells preincubated with 50 μg/ml GM1a, GM2, or GM3 for 24 h and then treated with vehicle control or TGF‐β for another 48 h were measured by immunoblotting. GAPDH: loading control.
- A549‐VIM‐RFP cells were pretreated with 50 μg/ml GM1a, GM2, GM3 or GD3 for 24 h and were then incubated with vehicle control or TGF‐β (2.5 ng/ml) for the indicated times. Real‐time expression of RFP‐tagged vimentin was monitored with an IncuCyte system, and the red object intensity was normalized to the red intensity at 0 h.
- Alexa Fluor 488 phalloidin staining of F‐actin (green) in A549‐VIM‐RFP cells preincubated with 50 μg/ml GM1a, GM2, GM3 or GD3 for 24 h and then treated with vehicle control or TGF‐β for another 48 h. Nuclei were counterstained with DAPI (blue). Images were acquired with confocal microscopy. Scale bar = 50 μm.
Data information: TGF‐β was applied at a final concentration of 2.5 ng/ml. The data are expressed as the mean ± SD values from three biological replicates (n = 3). *P ≤ 0.05; **P < 0.01; ***P < 0.001; ****P < 0.0001. In (A, C, D, F), statistical analysis was based on unpaired Student's t‐test. In (H, J), statistical analysis was based on two‐way ANOVA.
