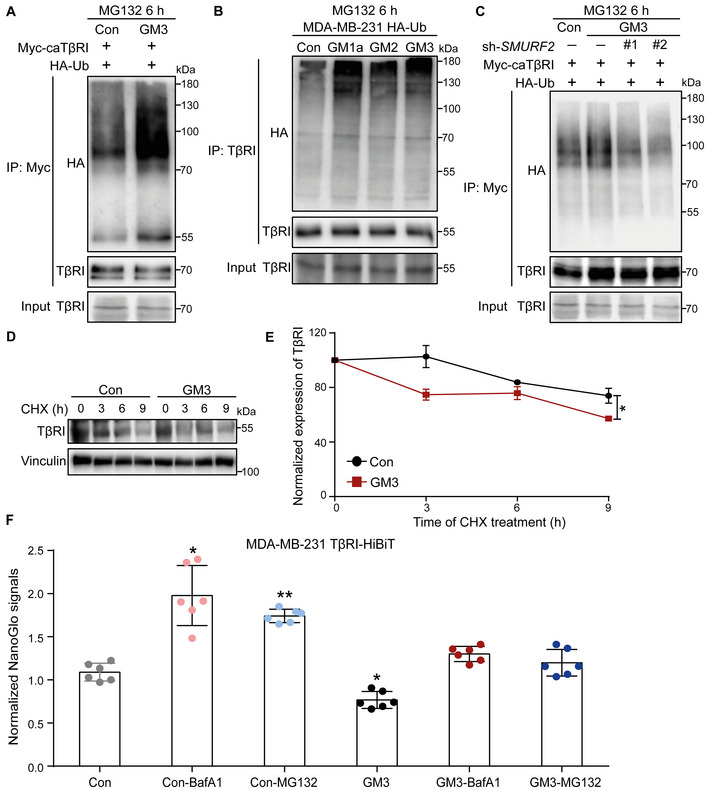
Figure EV4. related to Fig 6. ST3GAL5 and its downstream products, including GM1a, GM2, and GM3, promote TβRI ubiquitination and degradation by increasing the TβRI level in lipid rafts.

- Ubiquitination of TβRI was detected by IP of Myc‐tagged caTβRI from HA‐Ub‐transfected HEK293T cells with or without exogenous addition of GM3 (50 μg/ml) for 24 h. All groups were treated with MG132 (5 μM) for 6 h.
- Western blot analysis of whole‐cell lysates (Input) and immunoprecipitates from MDA‐MB‐231 cells stably expressing HA‐Ub with or without exogenous addition of 50 μg/ml GM1a, GM2 or GM3 for 24 h. Total ubiquitination of TβRI was evaluated. All groups were treated with MG132 (5 μM) for 6 h.
- HA‐Ub‐expressing HEK293T cells transfected with Myc‐tagged caTβRI and two SMURF2 shRNAs (sh#1 and sh#2) were treated with or without 50 μg/ml GM3 for 24 h. Cells were then harvested for IP with an anti‐Myc antibody followed by IB analysis of HA‐Ub and TβRI. All groups were treated with MG132 (5 μM) for 6 h.
- Western blot analysis of TβRI expression in A549‐VIM‐RFP cells with or without exogenous addition of GM3 (50 μg/ml) for 24 h followed by CHX treatment for the indicated times. Vinculin: loading control.
- Quantification of TβRI expression in the control and GM3‐treated groups of A549‐VIM‐RFP cells. Expression levels were normalized to the t = 0 controls. The data are shown as the mean ± SD of three independent experiments. *P ≤ 0.05 based on unpaired Student's t‐test.
- Measurement of TβRI‐HiBiT as evaluated by the Nano‐Glo signal in MDA‐MB‐231 cells with or without GM3 (50 μg/ml) challenge for 24 h followed by treatment with the proteasome inhibitor MG132 (5 μM) or lysosome inhibitor BafA1 (20 nM) for 6 h. The Nano‐Glo signal intensities were normalized to the GFP intensity in cells and are expressed as the mean ± SD of six biological replicates (n = 6). *P ≤ 0.05; **P < 0.01 based on unpaired Student's t‐test.
