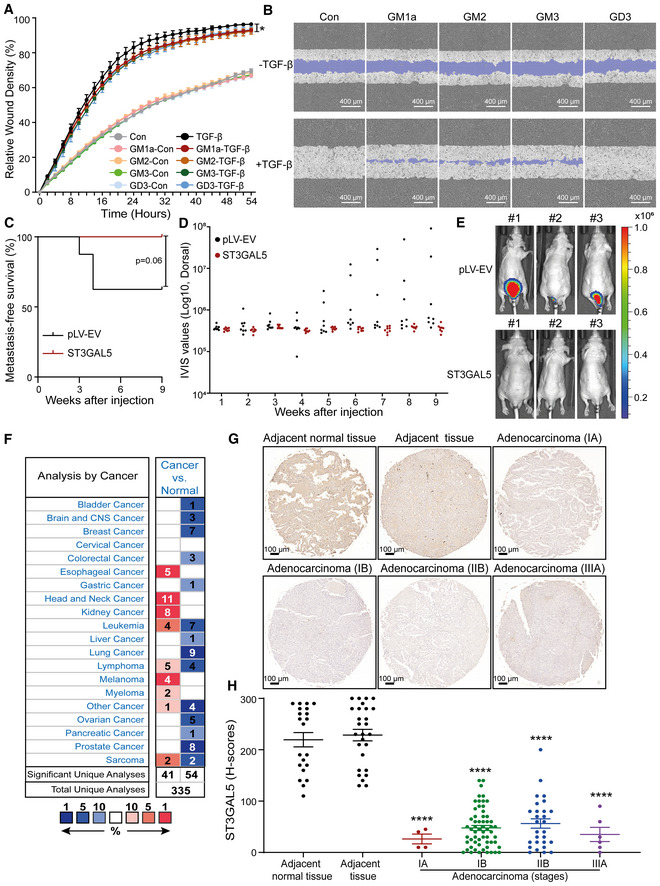
A549‐VIM‐RFP cells were pretreated with 50 μg/ml GM1a, GM2, GM3, or GD3 for 24 h and were then incubated with vehicle control or TGF‐β (2.5 ng/ml) for the indicated times. The time course of wound healing was analyzed by an IncuCyte system. The relative wound density (closure) values are presented as the means ± SD values from three biological replicates (n = 3). *P ≤ 0.05 based on two‐way ANOVA.
Representative images of a scratch wound at the 50 h time point in A549‐VIM‐RFP cells with exogenous addition of 50 μg/ml GM1a, GM2, GM3, or GD3 and treatment with vehicle control or TGF‐β (2.5 ng/ml). The original scratch region is indicated in purple. Scale bar = 400 μm.
Kaplan–Meier analysis of metastasis‐free survival of eight mice injected with A549‐Luc cells transduced with the pLV‐EV control or eight mice in the group with ST3GAL5 expression construct. The log‐rank test was used for statistical analysis; P = 0.06.
Analysis of the IVIS values from eight mice in each indicated group.
Whole‐body images (BLI) at 9 weeks of three mice injected with A549‐Luc cells transduced with the pLV‐EV control or ST3GAL5 expression construct. In Appendix Fig
S9D, the BLI of eight mice in each group are shown.
Oncomine database summary of ST3GAL5 gene expression in various cancers. The comparison indicates the number of datasets with statistically significant ST3GAL5 mRNA overexpression (red) and downregulation (blue) in cancer versus normal tissues. The colors indicate the best gene rank percentiles for the within‐data set analyses.
A microarray containing tissues from lung cancer patients was stained with an anti‐ST3GAL5 antibody. Representative images of lung cancer biopsies with adenocarcinoma and adjacent normal tissues are shown. Scale bar = 100 μm.
Scatter plot of ST3GAL5 expression in normal lung tissues and lung cancer tissues of different stages. Each point represents the H‐score from a single tissue sample with ST3GAL5 staining ranging from completely absent (H‐score: 0) to very strong (H‐score: 300). H‐scores are presented as the means ± SDs; adjacent normal tissue, n = 21; cancer‐adjacent lung tissue (adjacent tissue), n = 27; adenocarcinoma (stage IA), n = 4; adenocarcinoma (stage IB), n = 59; adenocarcinoma (stage IIB), n = 28; adenocarcinoma (stage IIIA), n = 6; ****P < 0.0001 based on unpaired Student's t‐test.

