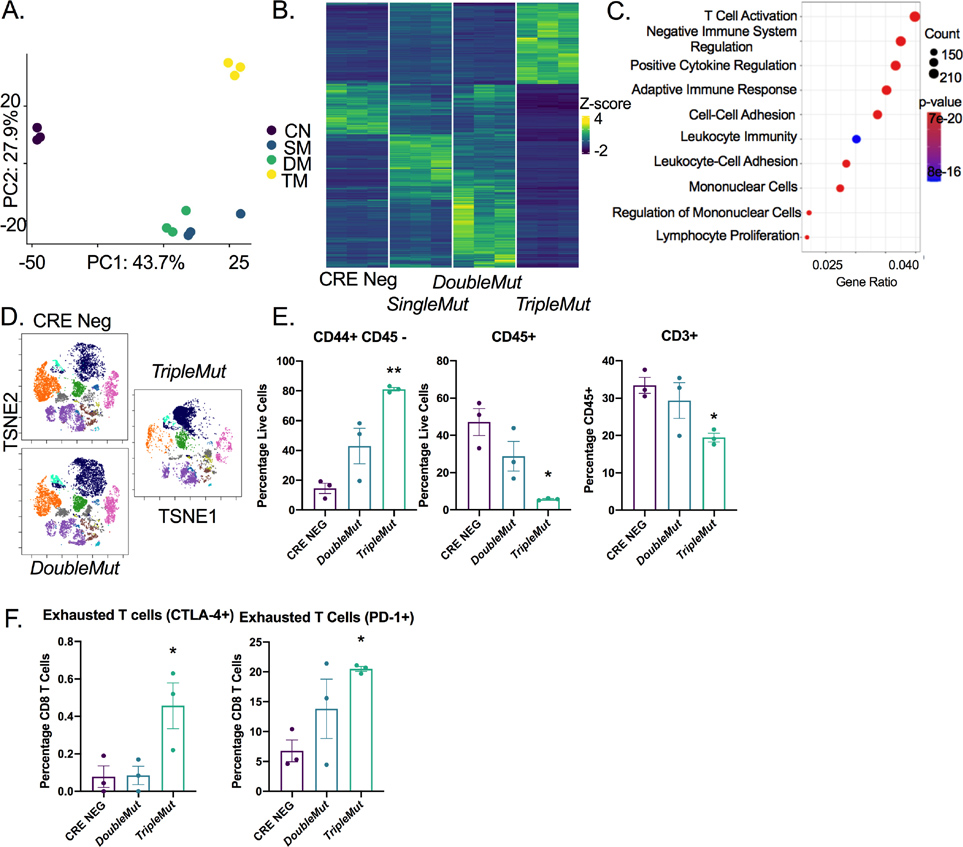
Figure 2: T cells are reduced in the TripleMut mice.
A) PCA analysis of RNA-sequencing of colon cancer mouse models induced with one dose of 100 mg/kg tamoxifen (n=3). B) Heat map and C) gene set enrichment of differentially expressed genes between mouse models (n=3). D) Representative TSNE plot of CyToF data of different mouse models induced with one dose of 100 mg/kg tamoxifen (n=3). E and F) Selected cell populations from CyToF data (n=3). *p < 0.05, ** p < 0.01, *** p < 0.001, **** p < 0.0001 unless otherwise indicated. Data is presented as mean ± SEM.

