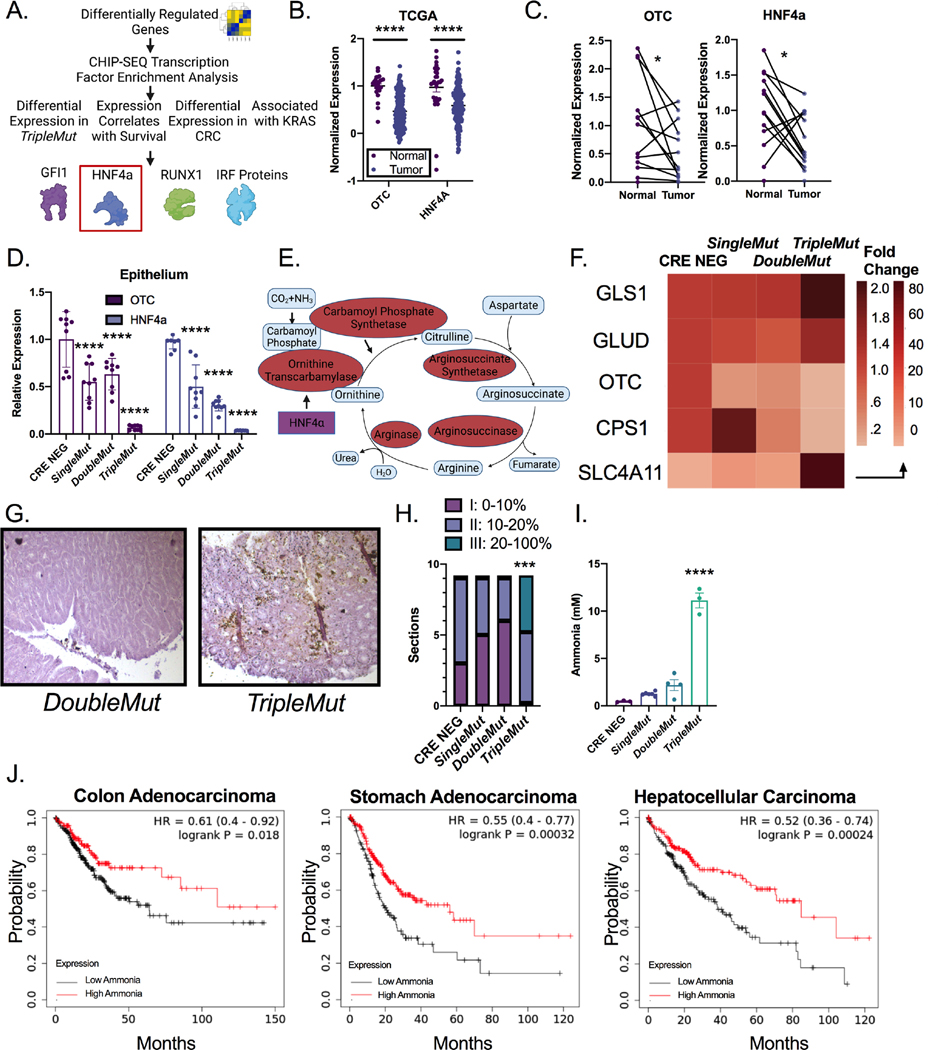
Figure 3: Ammonia metabolism is dysregulated in advanced colorectal cancer.
A) Schematic of transcription factor analysis. B) Schematic of urea cycle intermediates and enzymes. C) Heat map of expression of genes (GLS1 (Glutaminase-1), GLUD (Glutamate Dehydrogenase-1), OTC (Ornithine Transcarbamylase), CPS1 (Carbamoyl Phosphate Synthase-1), HNF4a (Hepatic Nuclear Factor 4 alpha), ARG (Arginase), ASS (Arginosuccinate Synthase), ASL (Arginosuccinate Lyase) and SLC4A11 (Solute Carrier Family 4 Member 11)) in the ammonia signature from RNA-Sequencing experiment. D) OTC and HNF4α expression in cancer and normal tissue from the TCGA dataset. E) Gene expression of HNF4α and OTC in normal and cancer patients. F) Gene expression of flow-sorted epithelial and stromal compartments. (n=6–8). G) Representative Nessler’s staining and H) quantification of mice induced with 100 mg/kg tamoxifen and sacrificed at endpoint (n=9). I) Mass spectrometry ammonia quantification of tumors from mice induced with 100 mg/kg tamoxifen. (n=3). J) Kaplan-Meier survival curves of cancer patients stratified by the ammonia gene signature. Data from TCGA. *p < 0.05, ** p < 0.01, *** p < 0.001, **** p < 0.0001 unless otherwise indicated. Data is presented as mean ± SEM.

