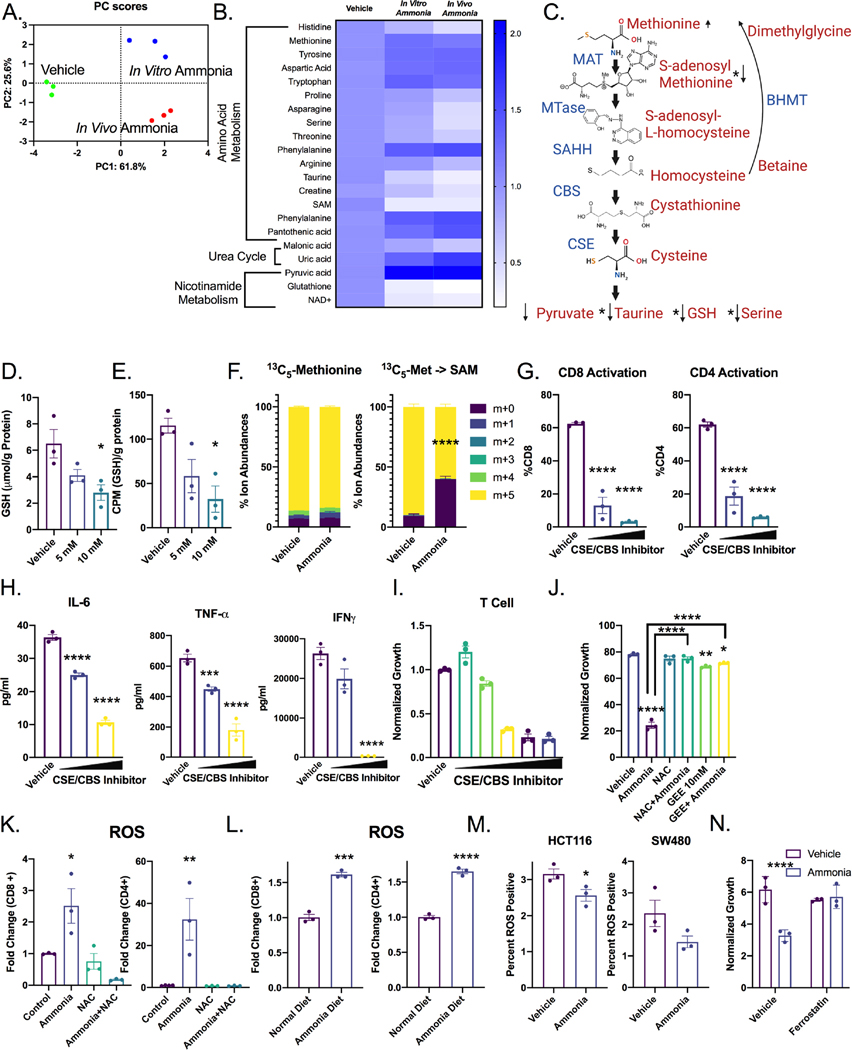
Figure 5: Ammonia leads to oxidative stress and dysregulated methionine metabolism in T cells.
A) PCA analysis and B) heat maps annotated with significant pathways from pathway analysis of metabolomics in T cells isolated from wildtype mice, mice treated with ammonium acetate diet or wildtype T cells treated with 10 mM ammonia in vitro for 24 h (n=3). C) Schematic of the transsulfuration pathway with selected metabolite relative levels indicated. D) Absolute quantification of GSH in in vitro treated mouse T cells. E) 35S tracing of methionine flux into GSH in in vitro treated mouse T cells. F) T cells were treated for 24 hours with 10 mM ammonia, labeled for 1 hour with radiolabeled methionine, then processed for mass spectrometry and analyzed for label incorporation. T cells were treated with CBS inhibitor CH004 (doses from 5–10 μM and CSE inhibitor propargylglycine (doses from 3–6 mM) for 24 hours, then G) activation was assessed by flow cytometry for CD25 and H) cytokine production was assessed using ELISA. I) Effect of CBS inhibitor CH004 (doses from 0.015–20 μM) and CSE inhibitor propargylglycine (doses from .01–6 mM) on T cell proliferation over 72 hours. J) T cells were treated for 24 h with 10 mM NAC and 10 mM GEE then treated with 10 mM ammonia for 72 h before CFSE was acquired using flow cytometry. K) T cells were treated with ammonia or cotreated with ammonia and NAC, and ROS was assessed by flow cytometry. L) Mice were treated with ammonium acetate diet for 7 days, then splenic T cells were assessed for ROS by flow cytometry (n=3). M) CRC-derived cell lines were treated with 10 mM ammonia for 72 h, assessed for lipid ROS by flow cytometry. N) T cells were pretreated for 24 h with ferrostatin (2 μm) followed by cotreatment with 10 mM ammonia for 24 h. *p < 0.05, ** p < 0.01, *** p < 0.001, **** p < 0.0001 unless otherwise indicated. Data is presented as mean ± SEM. All cell experiments were performed in triplicates at least three times.

