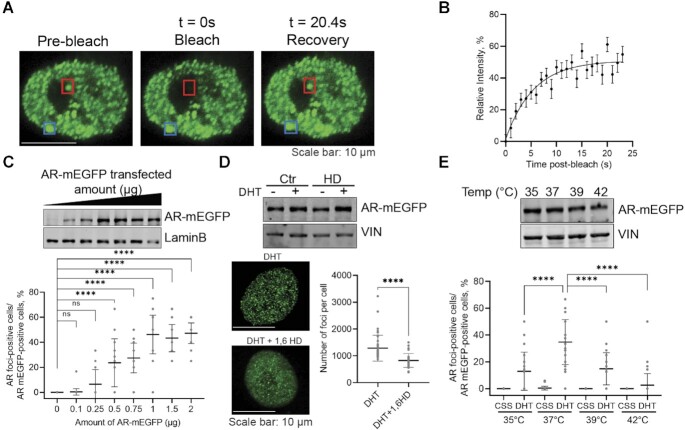
Figure 2.
AR foci present liquid-liquid condensate characteristics in AR-mEGFP expressing LNCaP cells. (A, B) FRAP assay to examine the diffusion of AR in and out the condensates. Cells were cultured in 5% CSS media for 2 days, then stimulated with 1 nM DHT for 2 h. Foci were photobleached with 100% of laser power for 10 s, the time-lapse imaging on the bleached punctum (red) as well as a reference punctum (blue) were captured with confocal microscope in a Z-stacking model (A). FRAP results are presented as mean ± SD (21 cells from 3 biological replicates) (B). (C) Foci numbers as a function of AR expression levels. Cells transfected with increasing amount of AR-mEGFP plasmid were cultured in 5% CSS media for 2 days and then stimulated with 1 nM DHT for 2 h. AR-rich foci were quantified by confocal microscopy. Data are presented as aligned points and the horizontal bar corresponds to the mean ± SD (45 fields were analysed from 3 biological replicates). The corresponding nuclear AR levels were evaluated by western blot (WB, anti-GFP antibody). (D) AR Foci's response to 1,6-hexanediol (HD). Cells cultured in 5% CSS for 2 days were stimulated with DHT for 2 h, treated with 4% 1,6-HD for 5 min and then fixed. The effect of 1,6-HD on AR protein level was evaluated by WB. The numbers of foci were quantified from 45 cells from three biological replicates and the data is presented as mean ± SD. The graph presents aligned points. (E) Foci formation at different temperatures. Cells starved in 5% CSS for 2 days were cultured at various temperatures for 1 h then 1 nM DHT was added for an additional h and AR-rich condensates were quantified. The effect of temperatures on the stability of AR protein was evaluated by WB. The aligned dotted blot presents the data from 45 fields from three independent experiments with mean ± SD. P values are indicated by stars: ns ≥ 0.05, * 0.01 to 0.05, ** 0.001 to 0.01, *** 0.0001 to 0.001, **** < 0.0001.

