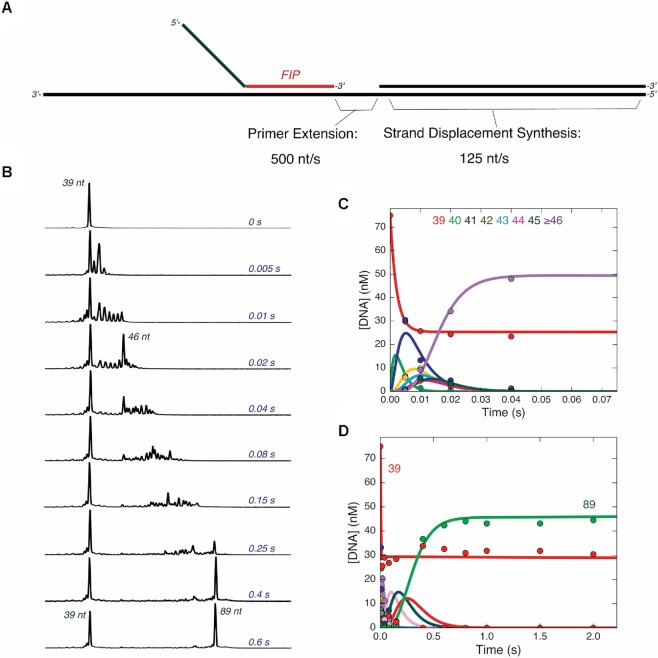
Figure 3.
Primer extension and strand displacement synthesis are fast. (A) Schematic of template DNA and primers used to measure extension. The DNA template is shown in black, consisting of LT-1 annealed to LT-2. The gap between the 3′ end of FIP and the 5′ end of LT-2 is 10 nt. (B) Rapid quench time course of strand displacement synthesis on linear DNA template. A solution of 75 nM FAM-FIP/LT-1/LT-2 and 400 nM Bst-LF polymerase was mixed with 400 μM dNTPs to start the reaction in the quench flow. Samples were quenched with EDTA and analyzed by capillary electrophoresis. For each electropherogram for each individual time point, retention time is given on the x-axis with increasing retention times from left to right, and fluorescence intensity the y-axis. Lengths of products corresponding to major peaks are shown in red. Reaction times are given on the right-hand side of the electropherograms in blue. Pausing at the 46 nt product occurs ∼3 bases before the start of the double stranded region. (C) Time course of primer extension reaction on single stranded template region. A plot of the concentration of each species from 39 to greater than or equal to 46 nt are shown, corresponding to the products formed during the primer extension reaction on the single stranded region of the template. Solid lines through the data are best fit curves to the fit by numerical integration of the rate equations in KinTek Explorer, giving an average rate of extension of 500 nt/s. (D) Time course of strand displacement synthesis reaction. A plot of the concentration of species from 39 to full length 89 nt product are shown, fit by simulation in KinTek Explorer represented by the solid curves going through the data points. The average rate of strand displacement synthesis derived from the fitting is approximately 125 nt/s.

