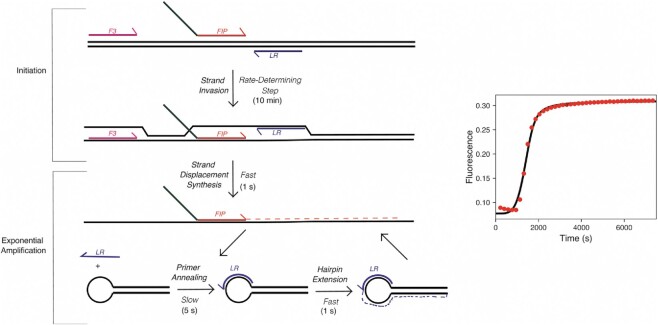
Figure 6.
Model for main kinetic steps in the LAMP reaction. Left: Schematic of LAMP reaction broken into kinetically significant steps. Template DNA is shown in black while F3, FIP, and LR primers are shown in pink, red and green, and blue, respectively. Approximate times to complete each step of the reaction are given next to each step. Right: Simulation of observed fluorescence in bulk LAMP reaction based on kinetic parameters determined in this study. Bulk LAMP OSD data are given in the red data points while the fit by simulation is given by the black line through the data points. The model, rate constants, and starting concentrations used in fitting are given in the materials and methods section.

