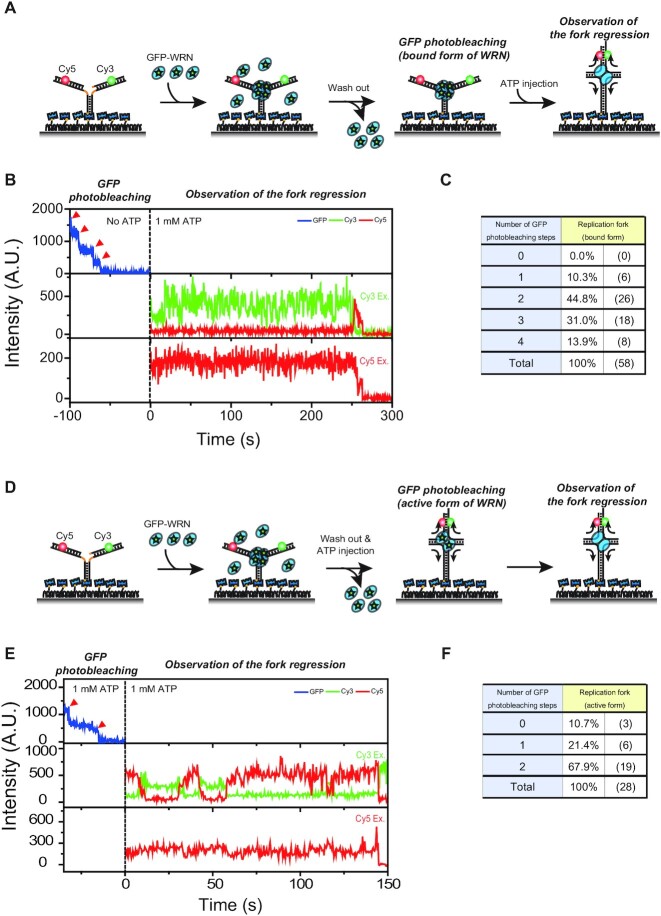
Figure 3.
Tetramer-to-dimer transition of WRN for replication fork regression. (A) The experimental scheme to check the unwinding activity of WRN after observing the oligomeric state of WRN binding to the model replication fork. (B) Representative fluorescence intensity time traces of the experiment (A). Photobleaching steps of GFP were counted in the absence of ATP. After the ATP injection, replication fork regression was observed. (C) Distribution of photobleaching steps of experiment (B). (D) The experimental scheme to observe the oligomeric state of WRN that is doing repetitive replication fork regression. (E) Representative fluorescence intensity time traces of the experiment (D). Photobleaching steps of GFP were counted in the presence of ATP, and the replication fork regression activity of WRN was checked using FRET in the Cy3/Cy5 imaging buffer. (F) Distribution of photobleaching steps of experiment (E).

