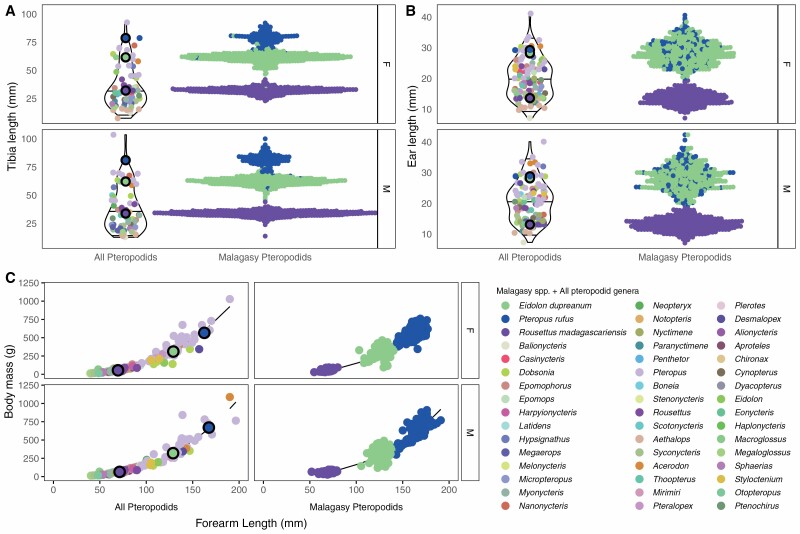
Fig. 2.
(A) Tibia, and (B) ear length across fruit bat species from the literature (left) and from our Madagascar field data (right), colored by genera according to legend; data are grouped by sex (upper = females, lower = males). Violin plots show range and 25%, 50%, and 75% quantiles for each distribution. (C) Linear regression of log10 body mass (in grams, y-axis) by log10 forearm length (in mm, x-axis) across pteropodids from the literature (left) and from all Madagascar field data (right), colored by genera according to legend; data are grouped by sex (upper = females, lower = males). Solid line corresponds to predictions from the fitted model (R2: all pteropodids, M = 0.96, F = 0.95; Malagasy pteropodids, M = 0.96, F = 0.97). Data are summarized in Supplementary Data SD1.B and SD1.C.

