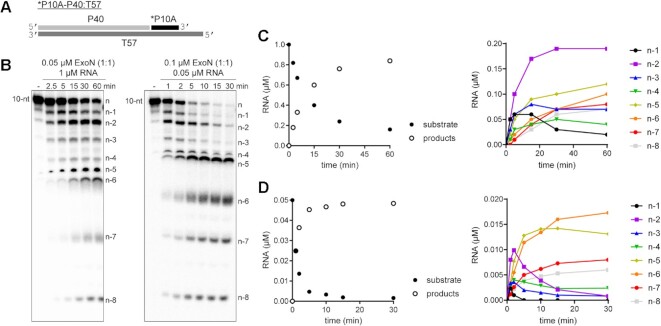
Figure 3.
Monitoring ExoN-catalyzed RNA hydrolysis at single-nucleotide resolution. (A) Schematic of dsRNA substrate used to monitor ExoN activity at single-nucleotide resolution. (B) Reactions contained 0.05 μM ExoN (1:1) and 1 μM RNA or 0.1 μM ExoN (1:1) and 0.05 μM RNA, were incubated for the indicated time, then quenched. Products were resolved using denaturing 20 or 23% polyacrylamide gels. The RNA cleavage products, n – 1 to n – 8, are indicated. (C, D) Quantitative analysis of kinetics of substrate RNA utilization and/or product RNA formation. Formation of individual products is shown on the right. Panel C reports on the experiment in which RNA was in excess of enzyme; panel D reports on the experiment in which enzyme was in excess of RNA.

