Figure 3.
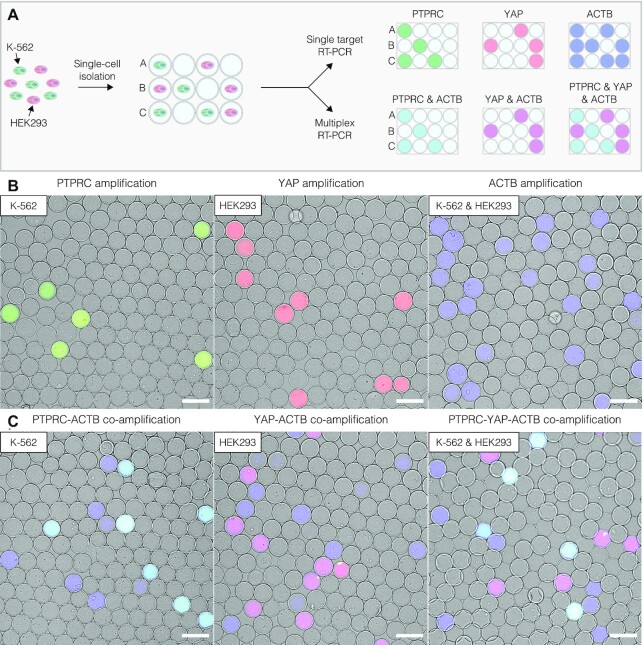
Digital gene expression profiling using microcapsule-based RT-PCR. (A) Schematic of the experimental design. The mixture of K-562 and HEK293 cells is loaded in microcapsules and subjected to uniplex RT-PCR or multiplex RT-PCR assay using fluorescently labelled primers targeting the transcripts of interest (PTPRC, YAP, ACTB). The digital gene expression profile of individual cells is then analyzed microscopically by layering the microcapsules on a hemocytometer and recording their fluorescence. (B) Epifluorescence images of microcapsules after RT-PCR reaction targeting one transcript of interest: PTPRC (green), YAP (red), or ACTB (blue). (C) Epifluorescence images of microcapsules after multiplex RT-PCR reaction simultaneously targeting two or three transcripts of interest. The microcapsules carrying both PTPRC and ACTB amplicons appear as cyan partitions; microcapsules carrying both YAP and ACTB amplicons appear as magenta partitions; microcapsules with ACTB amplicons appear as blue partitions. Scale bars, 100 μm.

