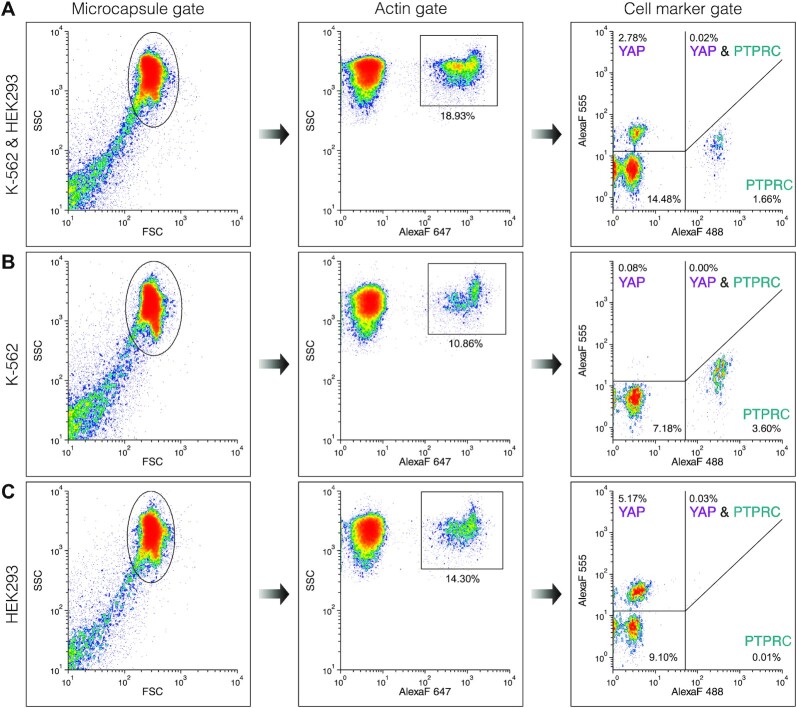
Figure 4.
Flow cytometry of individual cells based on intrinsic cell-specific marker expression. The FACS plots show three microcapsule samples containing a mixture of K-562 and HEK293 cells (A), K-562 cells (B) or HEK293 cells (C). The microcapsules were first gated based on forward vs. side scatter signal (Microcapsule gate). The resulting sub-population was then gated on ACTB marker expression (Actin gate) and finally, the expression of PTPRC and YAP markers was evaluated on the fluorescence scatter plot (Cell marker gene). The percentage indicates the total events.

