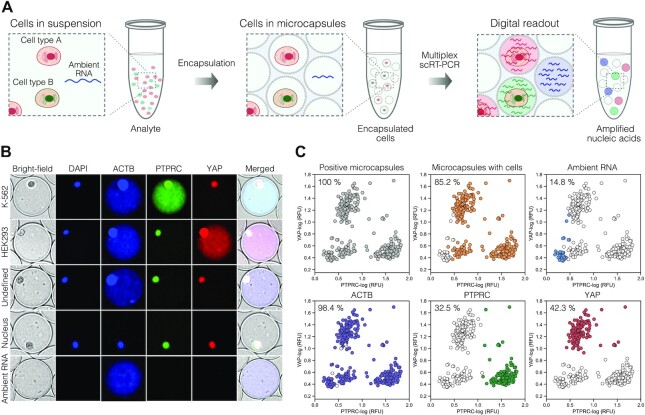
Figure 5.
Detection of true positive and false positive events using microcapsule-based multiplex RT-PCR assay. (A) Depiction of an experimental scheme where a typical biological analyte comprising cells and ambient RNA is partitioned in microcapsules, subjected to multiplex RT-PCR and evaluated by fluorescence imaging. (B) Representative microscopy images of the microcapsules after multiplex scRT-PCR targeting ACTB, PTPRC and YAP markers. Note, the cell nucleus exhibits spatially localized fluorescence in all channels, whereas the PCR amplicons show diffusive fluorescence signal occupying the entire core of a microcapsule. (C) Image-based characterization of a biological sample comprising a mixture of K-562 and HEK293 cells. Grey color depicts microcapsules that exhibit a fluorescent signal; orange – microcapsules that contain a cell; blue – microcapsules that exhibit RT-PCR signal lacking a cell; purple, green, and red colors depict microcapsules positive for ACTB, PTPRC and YAP signal, respectively. Each plot is represented by >300 counts. Local minimum was used to set the thresholds separating negative and positive events.

