Figure 2.
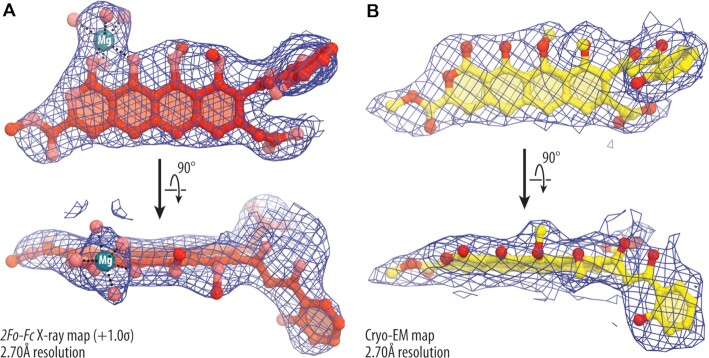
X-ray and cryo-EM maps of ribosome-bound thermorubin. (A) 2Fo-Fc Fourier electron density map of THR in complex with the T. thermophilus 70S ribosome (blue mesh) carrying only the P-site tRNA viewed from two different angles. The refined model of THR is displayed within its respective electron density map contoured at 1.0σ. (B) Cryo-EM map of the ribosome-bound THR in complex with the E. coli 70S ribosome (blue mesh) carrying both A- and P-site tRNAs. Carbon and oxygen atoms are colored red and salmon in (A), and yellow and red in (B), respectively. Magnesium ion is colored in teal. Note that the locations of all chemical moieties of THR can be unambiguously determined from the electron density map.

