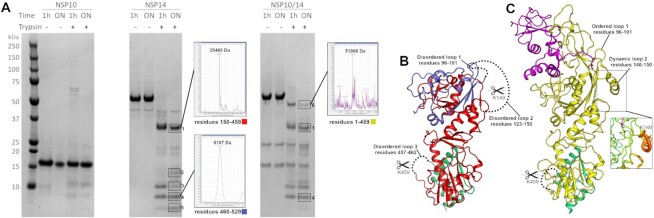
Figure 3.
Analysis of NSP14 conformation in solution by limited proteolysis coupled to Mass spectrometry. (A) Coomassie stained SDS PAGE gels of NSP10, NSP14 and the NSP14/10 complex upon limited proteolysis with trypsin. All samples were ran on a single gel which has been divided into sections for clarity. Prominent gel bands are boxed and numbered with deconvoluted spectra shown as insets for fragments that can be matched to cleavage products. (B) Interpretation of the digestion pattern mapped to the NSP14 structure. Red and green regions correspond to matched fragments following cleavage at disordered loops 2 and 3. The remaining residues at the N-terminus (colored in Blue) is a good match by mass to band 2 or may be further processed by cleavage at loop 1 to produce fragments matching bands 3 and 5. (C) Interpretation of the digestion pattern mapped to the NSP14/10 complex structure (5C8S). The yellow fragment is a match for band 6 and contains an intact N-terminal region, consistent with the disorder to order transitions involved in loops 1 and 2. The relative flexibility remaining around K149 may explain why there is still some cleavage at this site.

