
Figure 3.
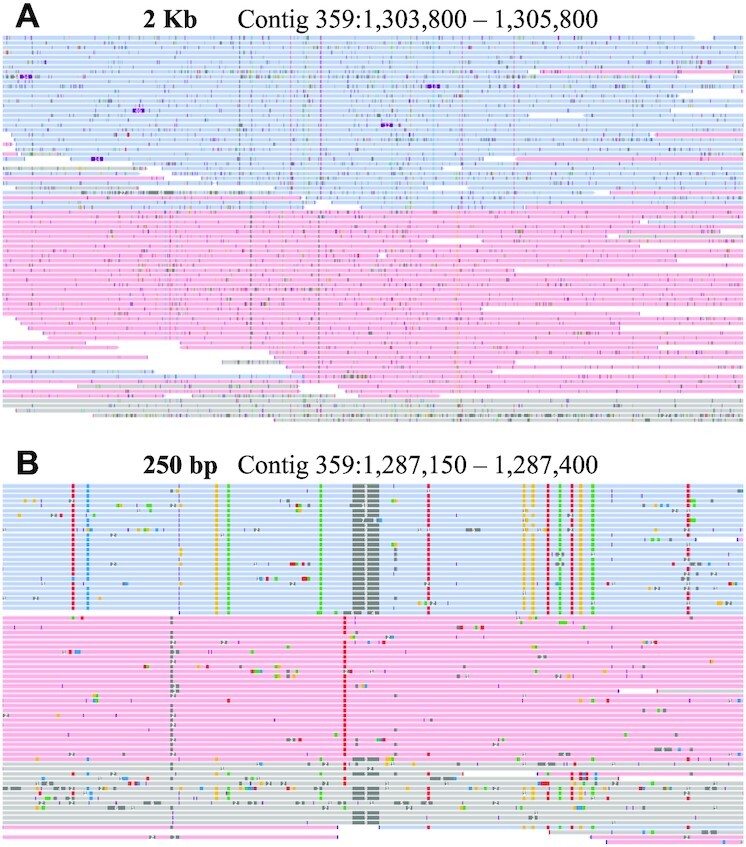
Phased genome view. Depiction of phased reads indicating parental haplotypes at two scales. (A) This 2 kb region illustrates large scale phasing and random sequencing errors. Haplotypes 1 is in blue, haplotype 2 is in red. (B) This 250 bp region illustrates haplotype-specific SNPs and a 9 bp indel in dark gray in haplotype 1. Phased reads show linkage between variants. Reads in gray were not assigned to a specific haplotype.