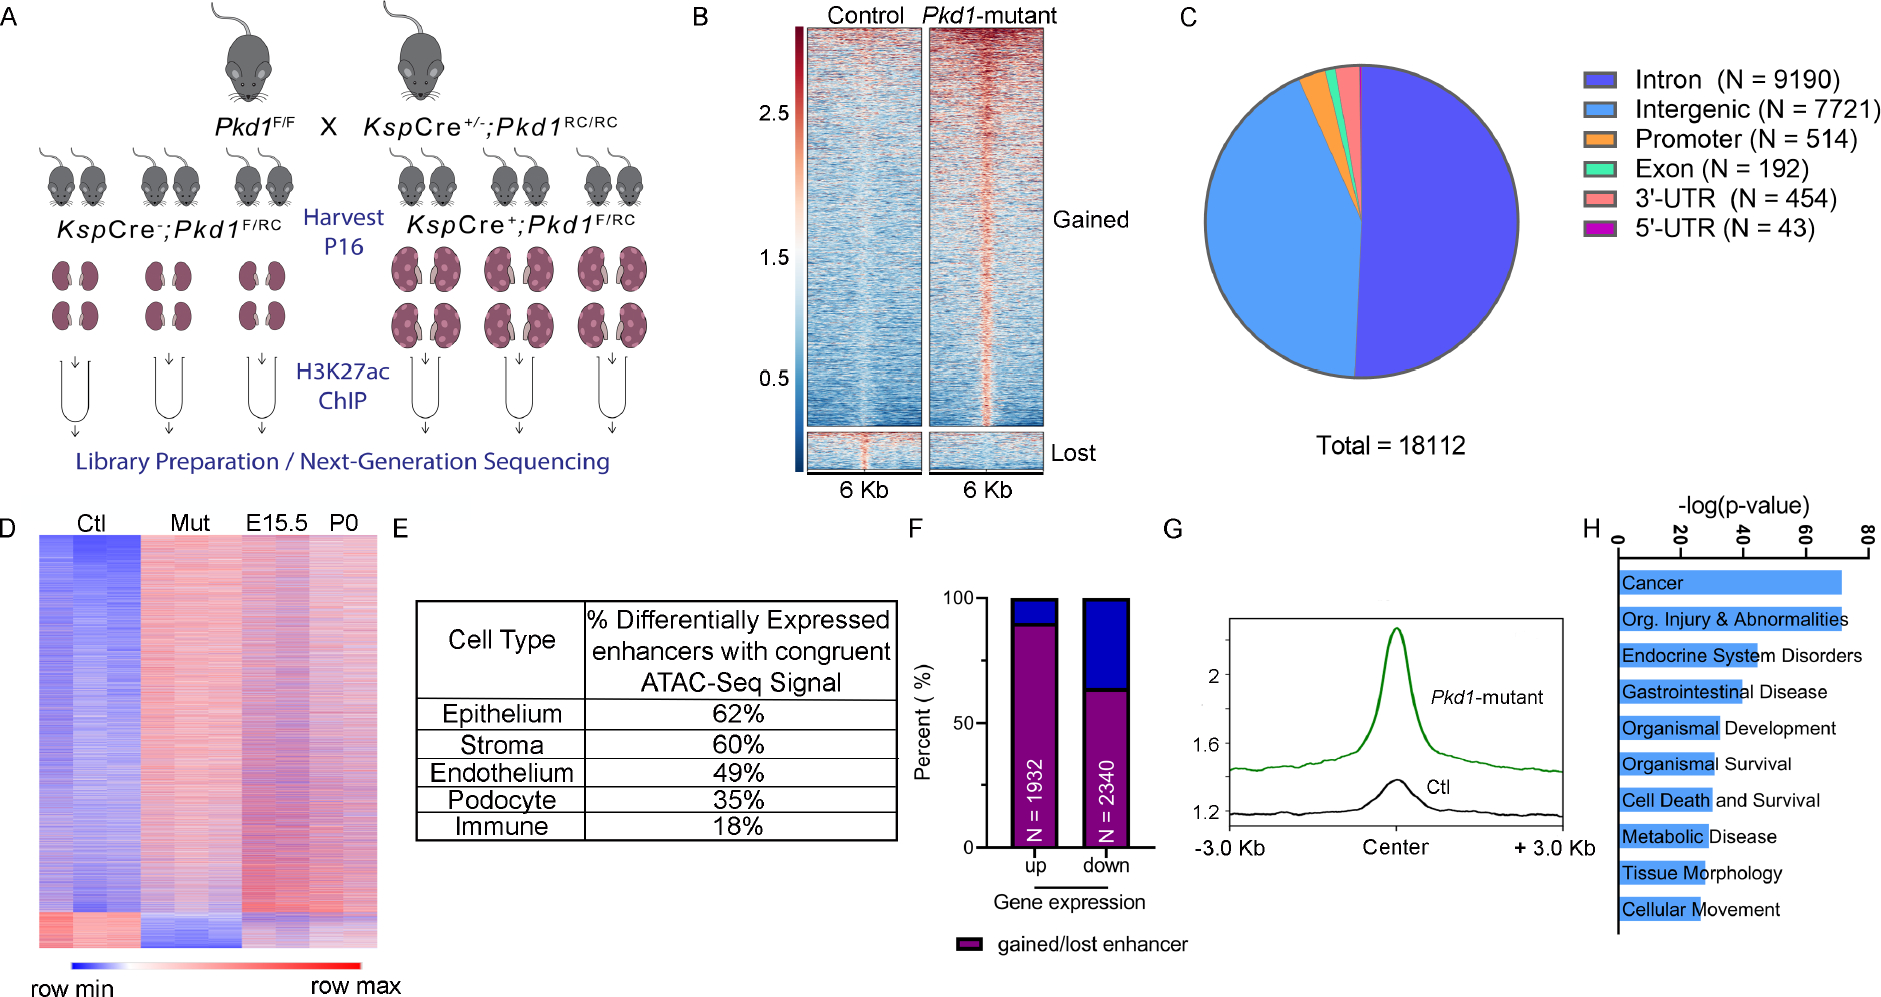
Figure 2. Comparative H3K27ac ChIP-seq uncovering the enhancer landscape in Pkd1-mutant kidneys.

A. Graphic illustration of the comparative H3K27ac ChIP-Seq experimental design is shown. ChIP-seq was performed using three biological replicate samples, each containing pooled chromatin from four 16-day-old kidneys from control or Pkd1-mutant mice. B. Heatmap showing the signal intensity of H3K27ac (+/− 3kb) around the center of each differentially activated enhancer ordered by mean signal. Pkd1-mutant kidneys gained (higher H3K27ac level) 16560 enhancers and lost (lower H3K27ac level) 1552 enhancers. C. Pie chart depicting the genome-wide distribution of the differentially activated enhancers is shown. D. Heatmap shows the comparison of RPKM of differentially activated enhancers between control and Pkd1-mutant kidneys and wildtype E15.5 and P0 kidneys. E. The bulk H3K27Ac ChIP-seq data were deconvoluted using the E18.5 wildtype snATAC-seq dataset. The cellular distribution of activated enhancers is shown. F. Overlap of the Pkd1-mutant ChIP-Seq and RNA-Seq showing that >90% of upregulated genes are located in a TAD which co-houses an activated enhancer, whereas 64% of downregulated genes are located in a TAD which co-houses a lost enhancer. G. Average H3K27ac signal intensity of enhancer regions in control (black) and Pkd1-mutant (green) kidneys samples within TADs that houses upregulated genes. H. Ingenuity Pathway Analysis depicting the top pathways regulated by active enhancer upregulated gene pairs.
