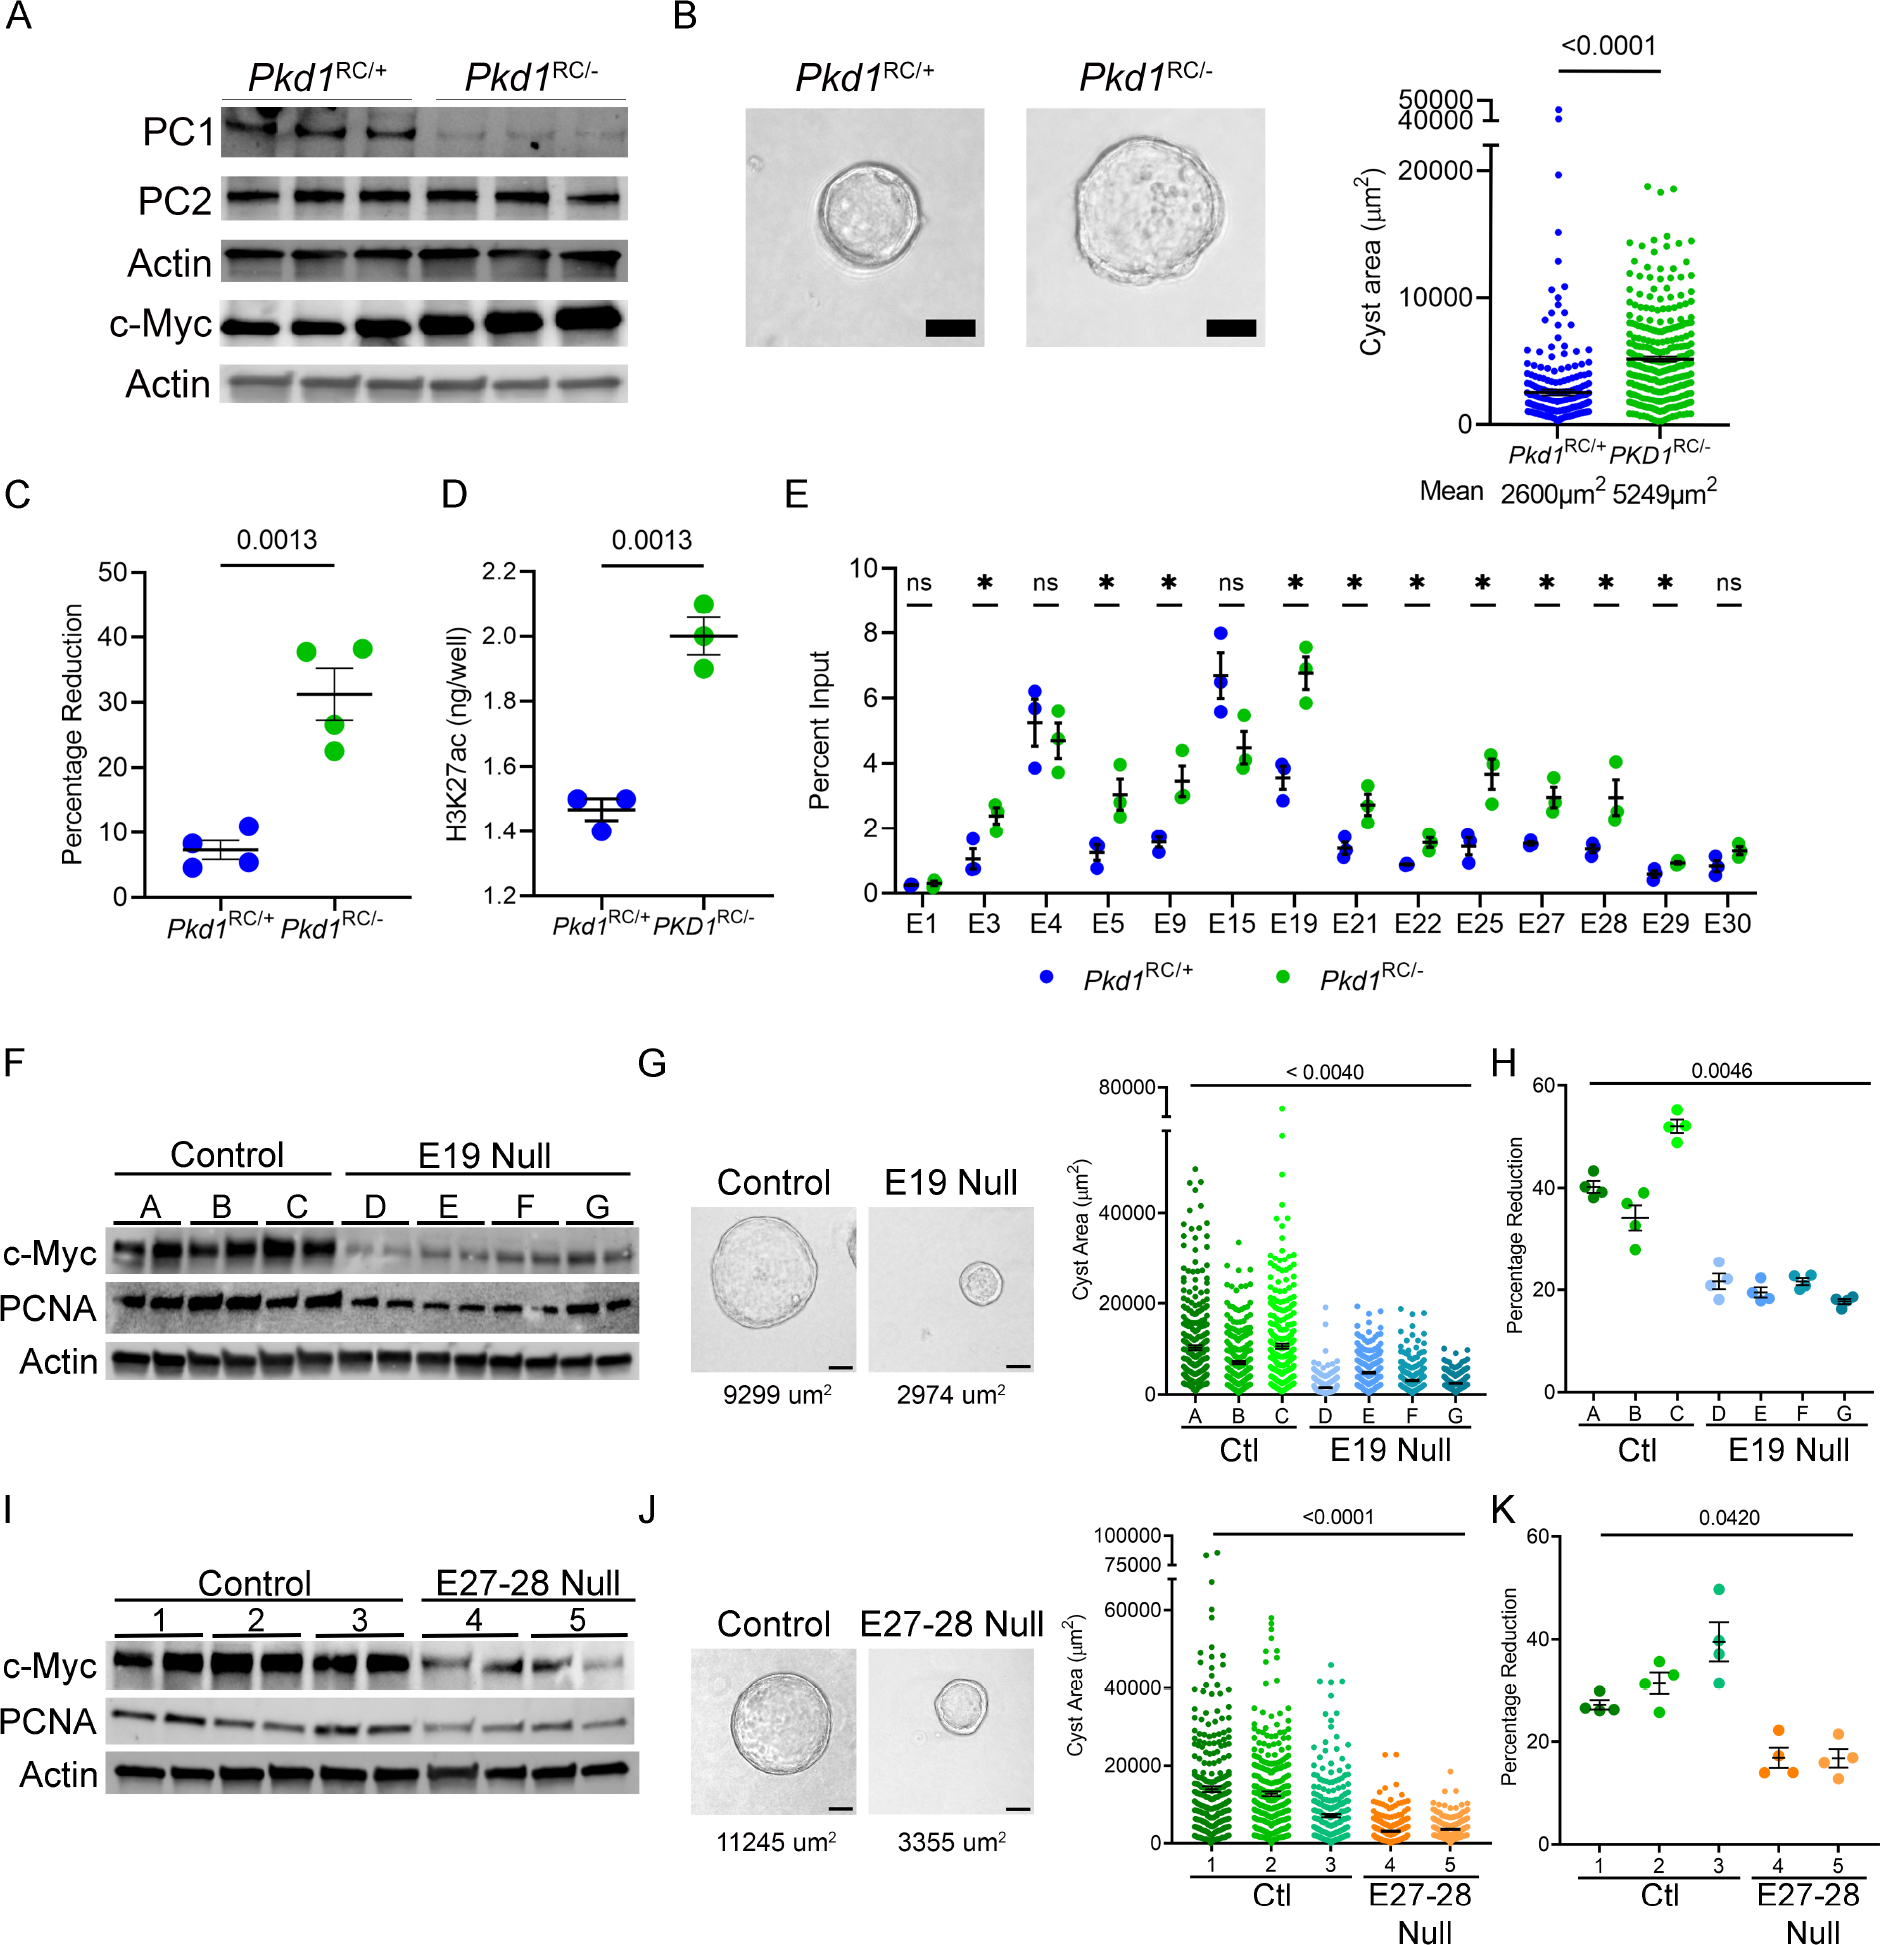
Figure 4. Enhancers activate c-Myc and regulate proliferation and cyst growth in Pkd1-mutant cells.

A. Western blot analysis showing reduced Polycystin1 (PC1) expression in Pkd1RC/− cells compared to parental Pkd1RC/+ cells. Polycystin2 (PC2) expression remained unchanged, whereas c-Myc expression was increased in Pkd1RC/− compared to Pkd1RC/+ cells. Actin serves as the normalizing loading control. B. Representative images and quantification showing increased cyst size of Pkd1RC/− compared to Pkd1RC/+ cells grown in 3D Matrigel for 7-days. C. Alamar Blue measurement 12 hours after incubation showing increased proliferation of Pkd1RC/− compared to Pkd1RC/+cells. D. ELISA showing higher global H3K27ac levels in Pkd1RC/− compared to Pkd1RC/+ cells. E. Comparative H3K27ac ChIP-qPCR validation of the c-Myc locus enhancers in Pkd1RC/− and Pkd1RC/+ cells. F. Western blot analysis showing reduced c-Myc expression in Pkd1RC/− cell lines lacking the E19 enhancer compared to the unedited Pkd1RC/− parental cells. G. Representative images and quantification showing reduced cyst size of E19-edited compared to unedited Pkd1RC/− cell lines grown 3D Matrigel for 7-days. Average cyst size for each group is reported. H. Alamar Blue-assessed proliferation rate of E19-edited and unedited Pkd1RC/− cells is shown. I-K. Western blot analysis, images and quantification of 3D cyst size, and Alamar Blue measurements showing reduced c-Myc expression, cyst size, and proliferation of Pkd1RC/− cells lacking the E27–28 enhancer cluster compared to the unedited parental Pkd1RC/− cells. Average cyst size for each group is reported. Images were taken at 20x magnification. N=300 (from 3 biological replicates) for all cyst measurements. N=4 biological replicates for all Alamar blue measurements. Error bars indicate SEM. * P < 0.05. ns = P > 0.05. Statistical analysis: Students t-test (B-E) and nested t-test (G, H) one-way ANOVA (J, K). Scale bars represent 25 μM.
