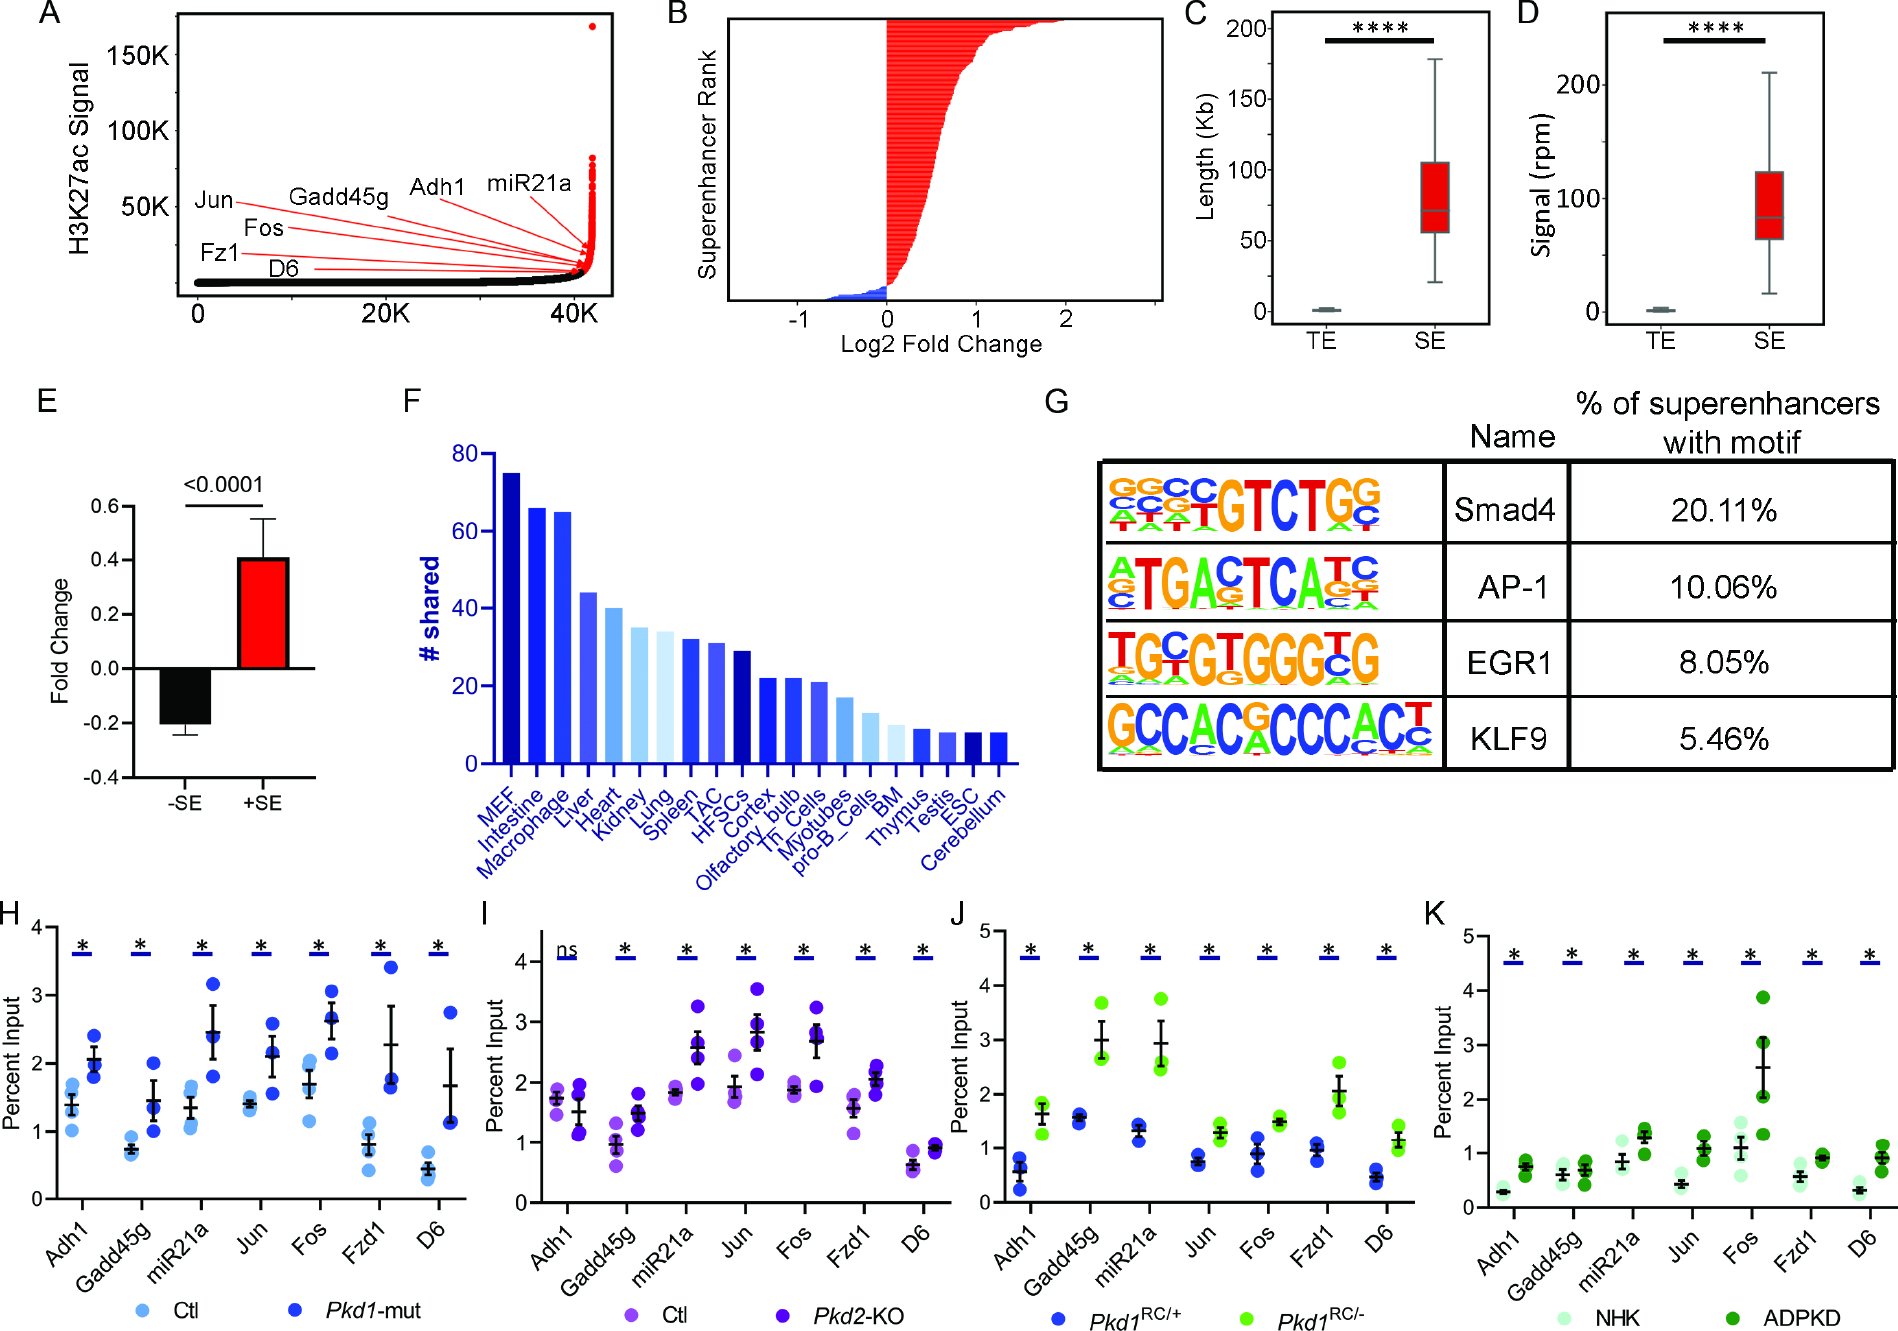
Figure 5. Super-enhancer landscape of ADPKD.

A. Hockey stick plot showing rank-ordered, input normalized H3K27ac signal in Pkd1-mutant and control kidneys. The CREs meeting the super-enhancer criteria are highlighted in red. Selected super-enhancers annotated based on nearest neighboring genes are shown. B. The graph depicts all differentially activated super-enhancers rank-ordered based on Log2 fold change in the H3K27ac signal in 16-day-old Pkd1-mutant compared to control kidneys. Red indicates super-enhancers with higher and blue indicates those with lower H3K27ac signal in Pkd1-mutant compared to control kidneys. One hundred five super-enhancers were gained, and five were lost in Pkd1-mutant compared to control kidneys. C and D. Quantification of genomic length and H3K27ac signal intensity of Pkd1-mutant gained super-enhancers (SE) versus total enhancers (TE) is shown. E. Average fold change of differentially expressed genes is 300% higher in TADs which house a gained super-enhancer compared to average fold change of genes which do not reside in a TAD with a gained super-enhancer. F. The Pkd1-mutant and dbSUPER super-enhancer datasets were cross-compared. The graph depicts the common super-enhancers found in both databases broken down based on cell and tissue type. G. Motif analysis of super-enhancers using the Homer software is shown. H-K. ChIP-qPCR validation of selected super-enhancers in Pkd1-mutant and Pkd2-KO kidneys, Pkd1RC/− cells, and human ADPKD samples compared to their respective controls. N = 3–4 all groups. * P < 0.05, **** P <0.001. ns = P > 0.05. Error bars indicate SEM. Statistical analysis: Nested t-test (C and D), Student’s t-test (H-K)
