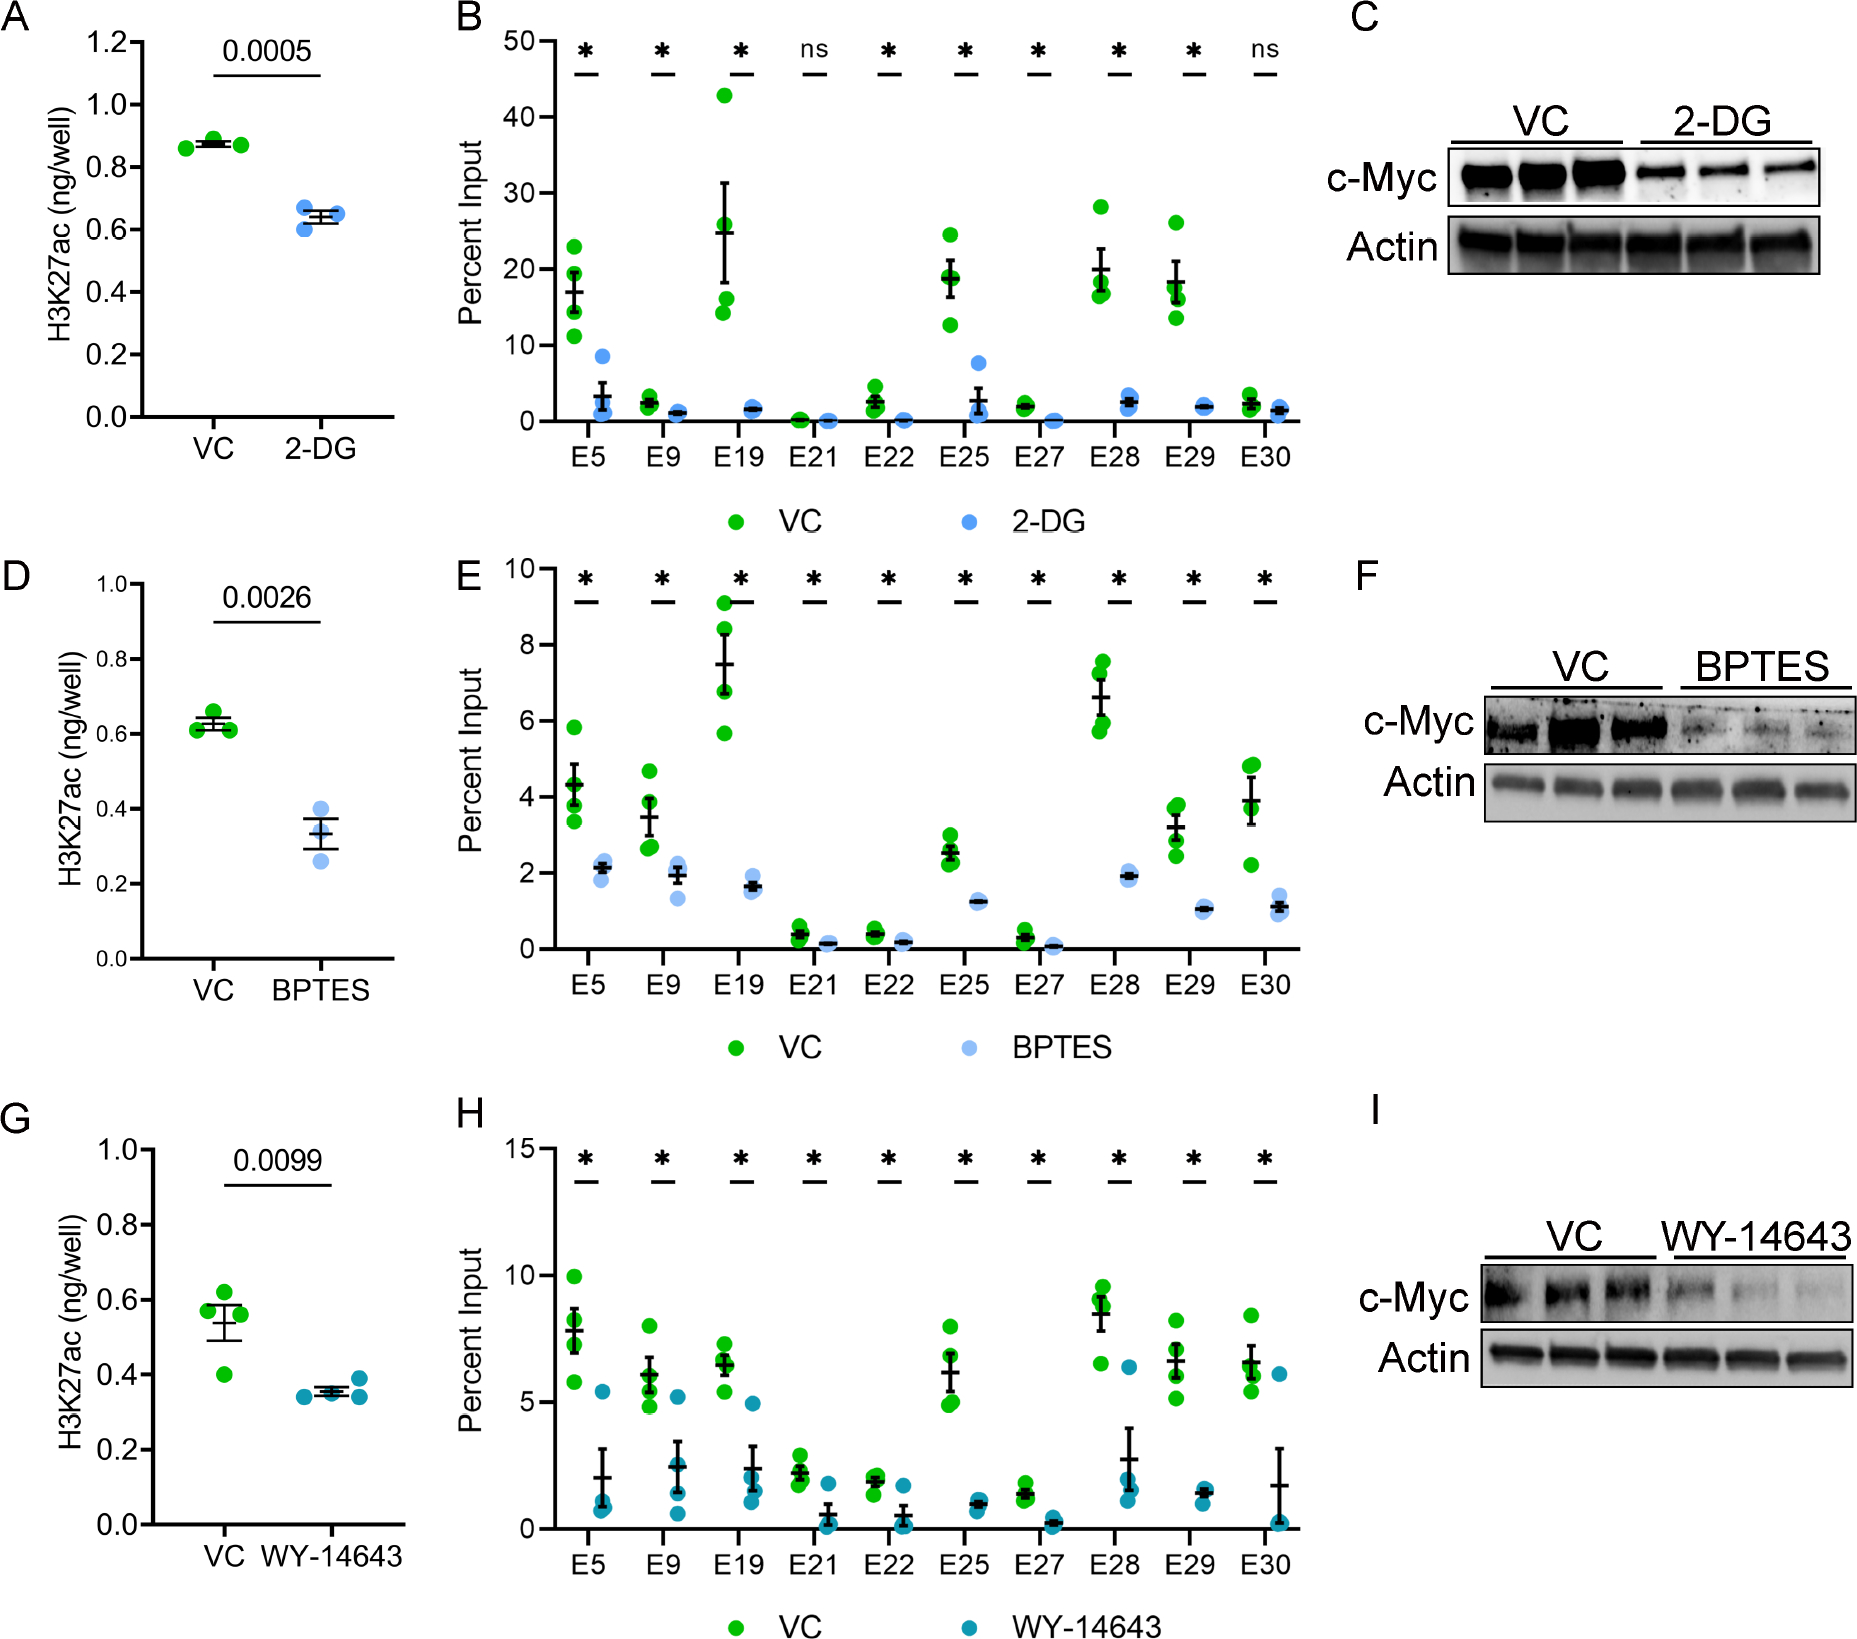
Figure 7. Metabolic pathways influence H3K27ac levels in Pkd1-mutant cells.

A. Pkd1RC/− cells were treated with 2-DG, an inhibitor of aerobic glycolysis, or vehicle control for 24 hours. ELISA revealed that histone extracts from 2-DG-treated cells had reduced H3K27ac levels compared to vehicle-treated cells. B. ChIP-qPCR showed reduced H3K27ac modification on c-Myc enhancers in Pkd1RC/− cells treated with 2-DG compared to vehicle control. C. Western blot analysis showing reduced c-Myc expression in 2-DG-treated compared to vehicle-treated Pkd1RC/− cells. D. Pkd1RC/− cells were treated for 48 hours with vehicle or BPTES to inhibit glutaminolysis. ELISA revealed that BPTES-treated cells had a reduced level of H3K27ac histone modification compared to vehicle-treated cells. E. ChIP-qPCR showing reduced H3K27ac modification on c-Myc locus enhancers in BPTES-treated compared to vehicle-treated Pkd1RC/− cells. F. Western blot analysis showing reduced c-Myc expression in Pkd1RC/− cells treated with BPTES compared to control vehicle. G-I. Pkd1RC/− cells were treated for 72 hours with the Ppara agonist WY-4643 or control vehicle. ELISA revealed reduced global H3K27ac levels, ChIP-qPCR showed lower H3K27ac signal on c-Myc enhancers, and Western blot analysis demonstrated c-Myc downregulation in WY-4643-treated compared to vehicle-treated Pkd1RC/− cells. N=3–4 all groups. * P < 0.05, ns = P >0.05. Error bars indicate SEM. Statistical analysis: Student’s t-test.
