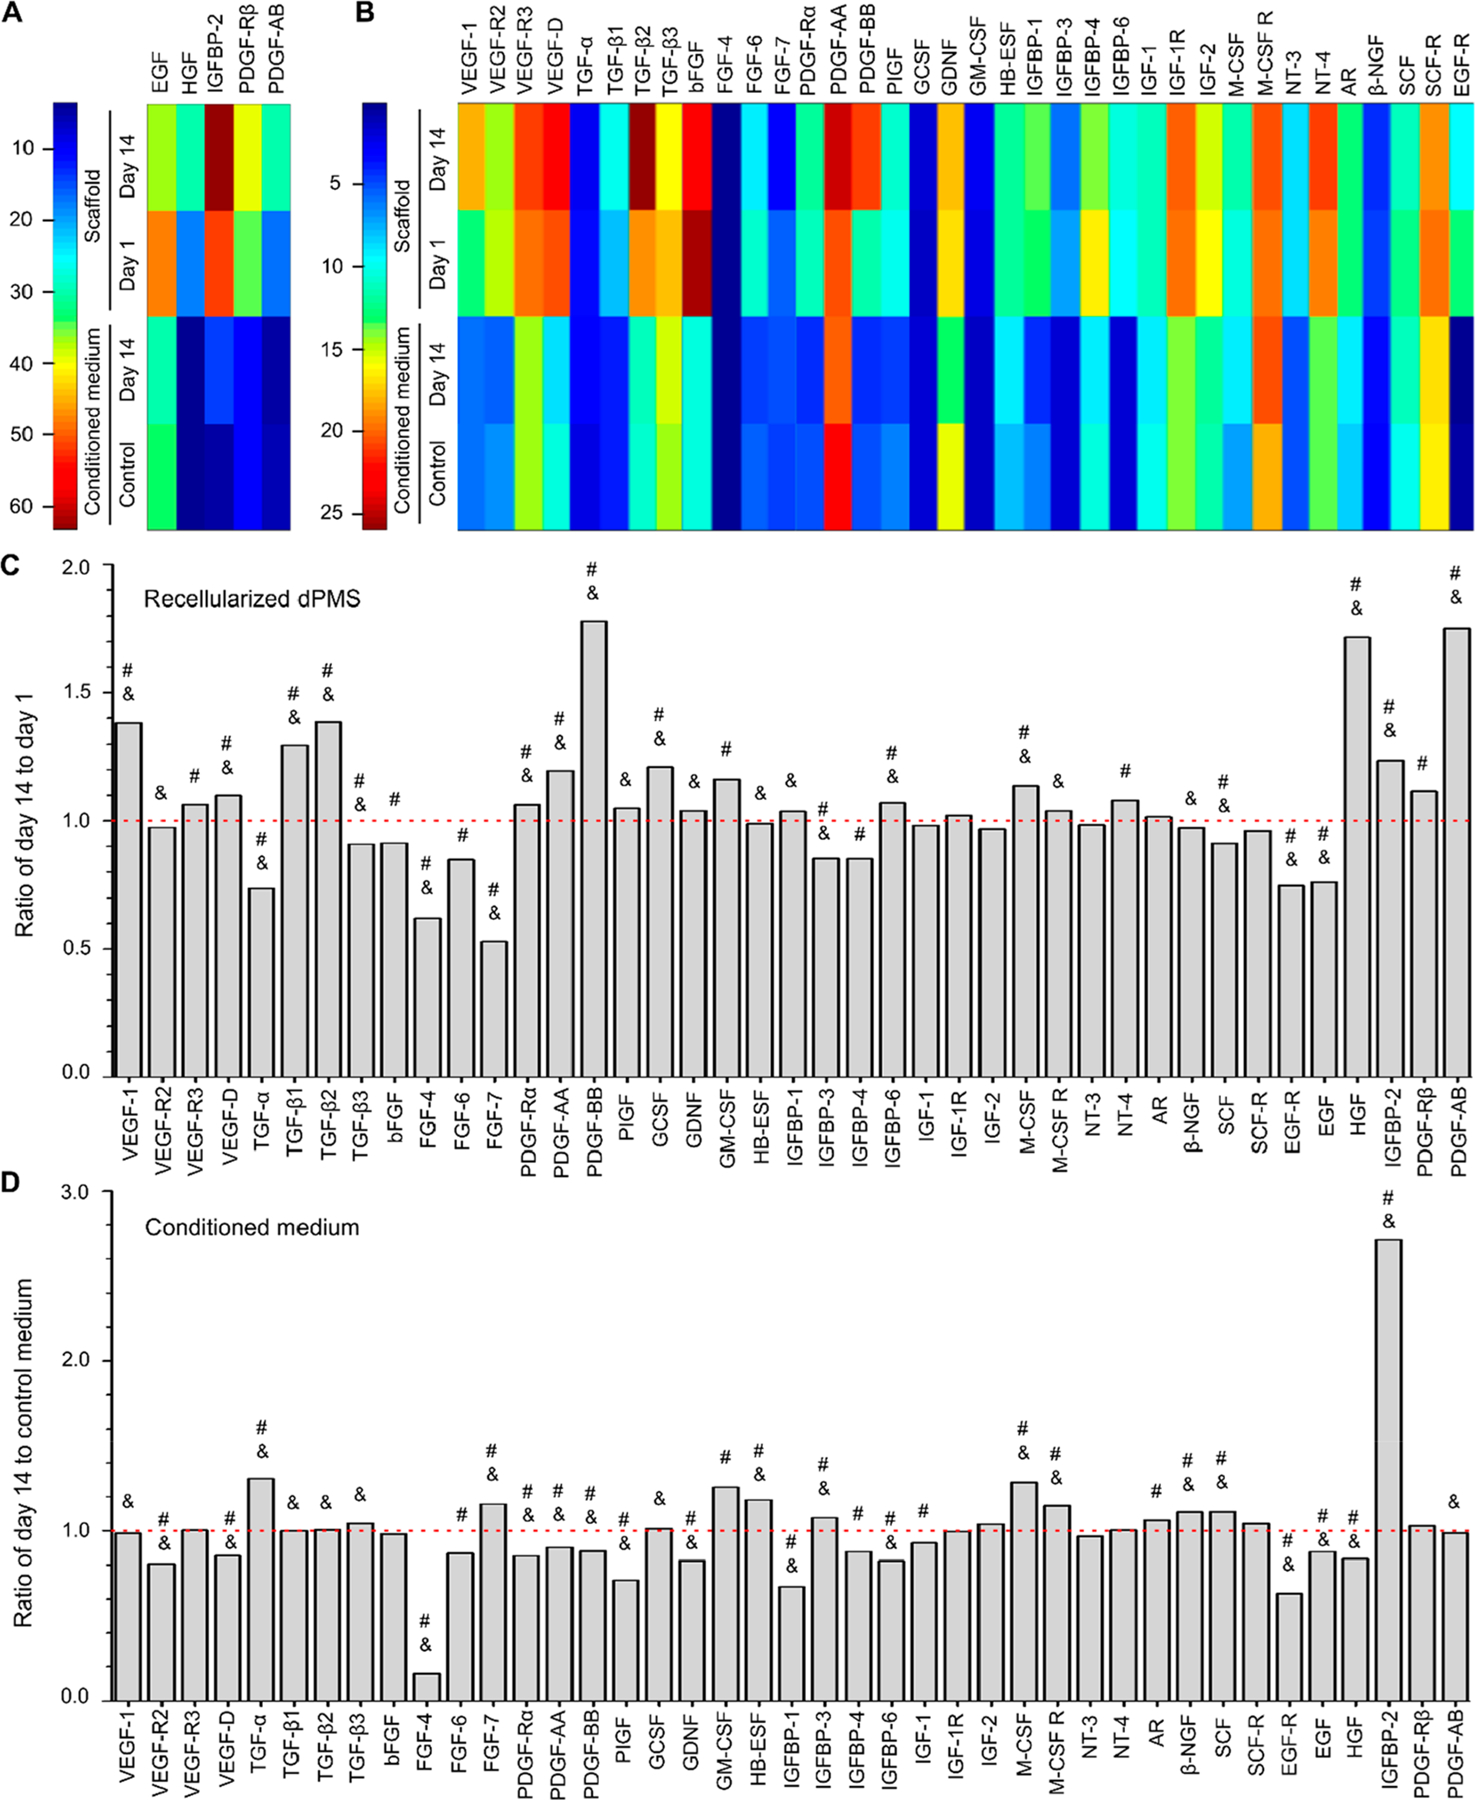
Figure 4.

Growth factor secretion of cells in dPMS. Heat map analysis to demonstrate the expression level changes of specific human growth factors at large (A) and small scales (B). In the heat map, each column represents an individual growth factor and each row represents the tested sample. n = 4. The color bars denote the heat intensity for the expression value, with red indicating upregulated growth factors and blue indicating downregulated growth factors. Semiquantitative analysis of growth factors retained in the dPMS (C) and released into the conditioned medium (D) The y-axis represents the fold-change of growth factors from samples collected at day 14 after cell seeding to dPMS compared to day 1 (indicated by the red dotted line) (n = 4). #Represents the expression level ratio significantly different from 1 and marks the growth factor that has significantly different expression level ratios between in recelluarized dPMS and conditional medium. The full form of abbreviated growth factors is provided in the SI (Table S1).
