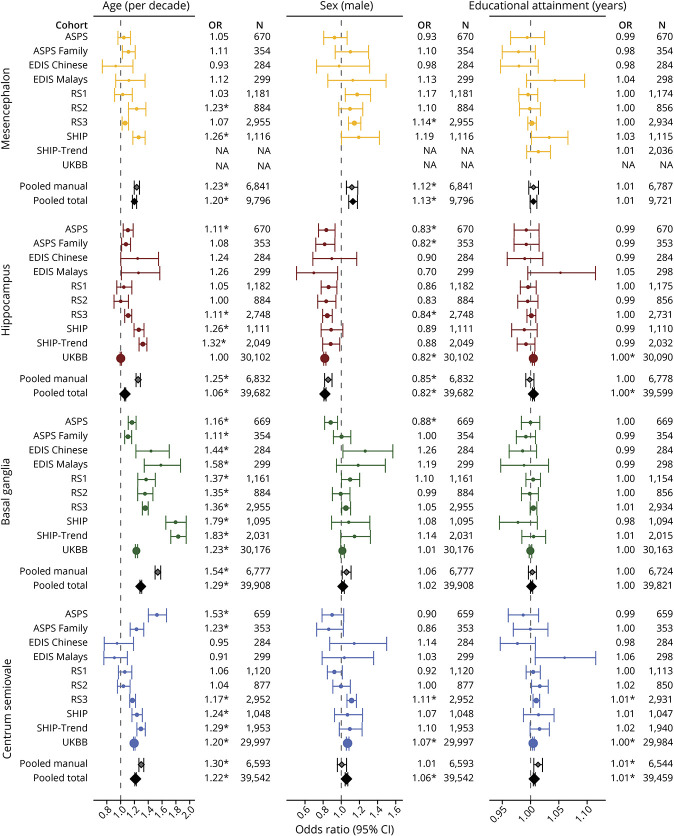
Figure 3. Study-Specific and Pooled Associations Between Demographic Factors and the Number of PVS in the 4 Brain Regions.
Forest plot showing odds ratios with corresponding 95% confidence intervals for the association between demographic factors and PVS counts in the 4 brain regions, both from 10 individual sites and pooled analyses. *Survived multiple testing correction (p < 0.05/19). Abbreviations: PVS = perivascular spaces.

