
Figure 4.
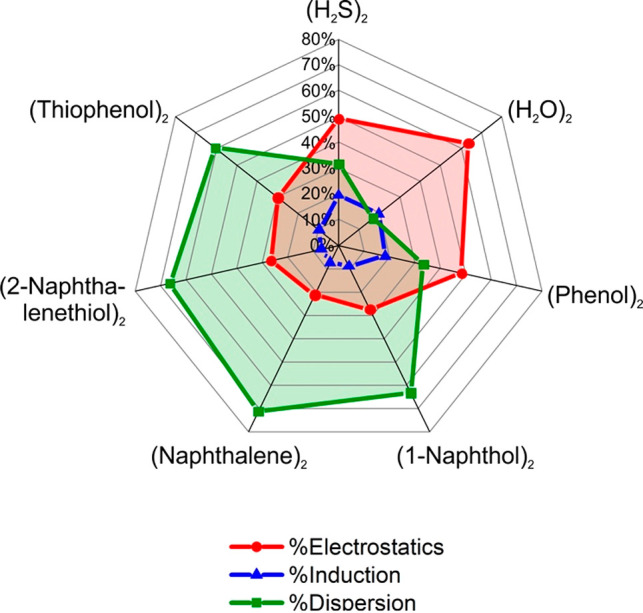
SAPT energy decomposition for the 2-naphthalenethiol dimer and related complexes. The radar chart shows the percentage of electrostatic, induction, and dispersion energy compared to the total stabilization energy in each complex. See Table 2 and Figure S12 for the total energy values.