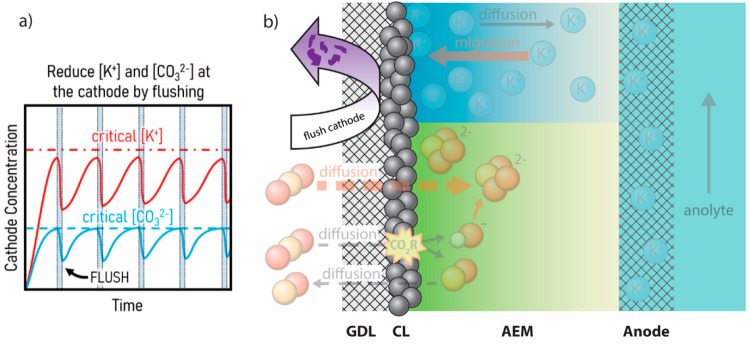
Figure 3.
(a) Plot of cathode concentration versus time showing the general trends of K+ and CO32– concentrations at the cathode during active flushing of the cathode compartment with water. (b) Schematic depiction of actively mitigating the buildup of ions and nucleation of crystal seeds on the catalyst by dissolving and removing salt from the cathode with water.

