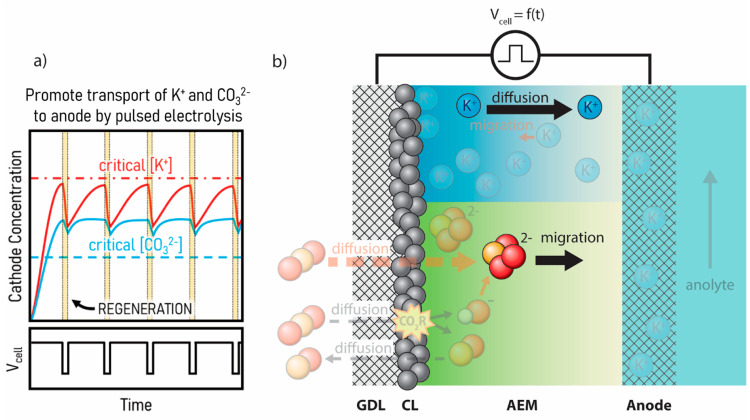
Figure 4.
(a) Plots of cathode concentration and cell voltage versus time showing the general trends of K+ and CO32– concentrations at the cathode during pulsed electrolysis. (b) Schematic depiction of ion-transport during a “pulse” of lower voltage. At the lower regeneration voltage, the reaction slows down and migration of carbonates and K+ allow the system to partially homogenize before returning to the operational voltage.

