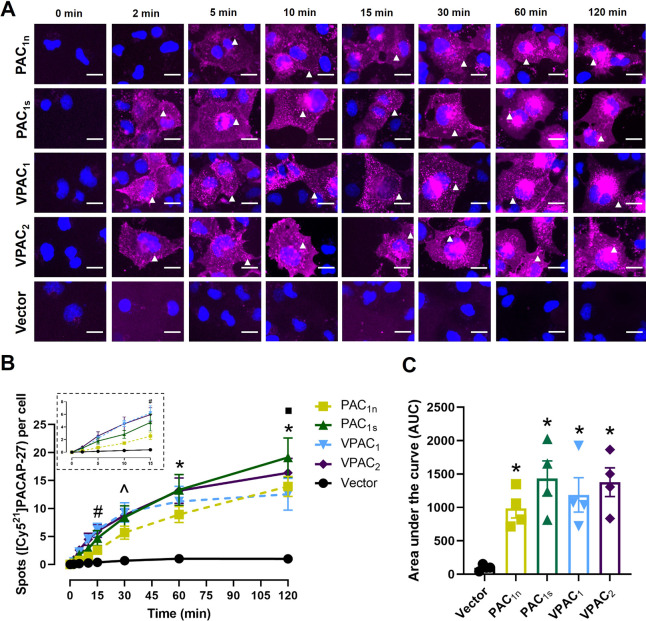
Figure 5.
Internalization of [Cy521]PACAP-27 (10 nM) over time in Cos7 cells transfected with the PAC1n, PAC1s, VPAC1, and VPAC2 receptors. (A) [Cy521]PACAP-27 fluorescence shown in magenta and nuclear DAPI in blue; white arrowheads indicate examples of spots. Images are representative of one field of view from 4 independent experiments. Scale bar, 20 μm. (B) Quantification of the number of [Cy521]PACAP-27 spots per cell at each time point. (Inset) Magnified view of the spot number from 0 to 15 min. Statistical significance was determined by repeated measures two-way ANOVA with post hoc Tukey’s test comparing all receptors and vector-transfected cells to each other at each time point. * p < 0.05 for all receptors compared to vector-transfected cells, ■ p < 0.05 for VPAC1 compared to PAC1s, ^ p < 0.05 for PAC1s, VPAC1, and VPAC2 compared to vector-transfected cells, and # p < 0.05 for VPAC1 and VPAC2 compared to vector-transfected cells. (C) Area under the spot counting curve from B. Statistical significance was determined by one-way ANOVA with post hoc Tukey’s test. * p < 0.05 compared to vector-transfected cells. Data in B and C are plotted as the mean ± SEM combined from 4 independent experiments.

