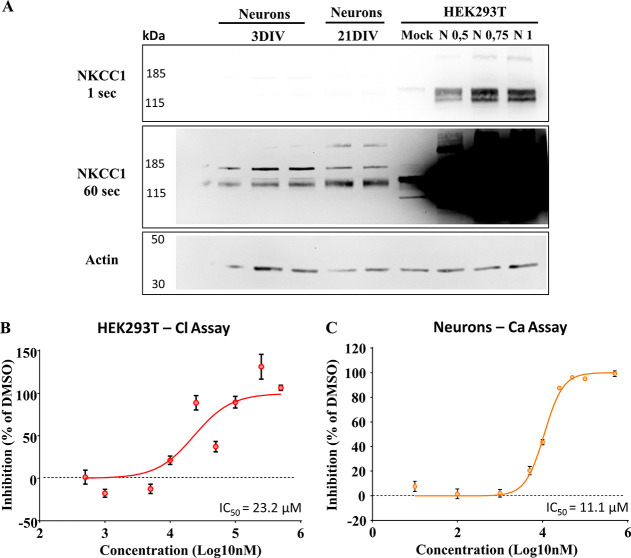
Figure 1.
In vitro characterization of ARN23746. (A) Representative immunoblots showing the highly different expression of NKCC1 in the different cells used for the in vitro assay. From the left, 3DIV neurons, 21DIV neurons, and HEK293T cells non-transfected (Mock) or over-expressing different amounts of NKCC1 plasmid (0.5, 0.75, and 1 μg). To appreciate the different NKCC1 expression (signal), membranes were exposed at two different time points (1 s, 60 s). On the left kilodaltons (kDa) of the marker bands are indicated. (B) Dose–response curve of ARN23746 in HEK293T cells over-expressing NKCC1 with Cl–-influx assay. Quantification of the mean ± SEM of NKCC1 inhibition by ARN23746 at the indicated concentrations (n = 3–10 for each concentration; one outlier was excluded from concentrations 50 μM and 500 μM based on Grubbs’s test). Non-linear fit of log(inhibitor) vs normalized response-variable slope (degrees of freedom = 152, R2 = 0.56). (C) Dose–response curve of ARN23746 in young neurons with Ca2+-influx assay. Quantification of the mean ± SEM of Ca2+-influx inhibition by ARN23746 at the indicated concentrations (n = 4–10 for each concentration; one outlier was excluded from concentrations 1 μM and 10 μM; two outliers were excluded from concentrations 5 μM and 100 μM based on Grubbs’s test). Non-linear fit of log(inhibitor) vs normalized response-variable slope (degrees of freedom = 168, R2 = 0.94).

