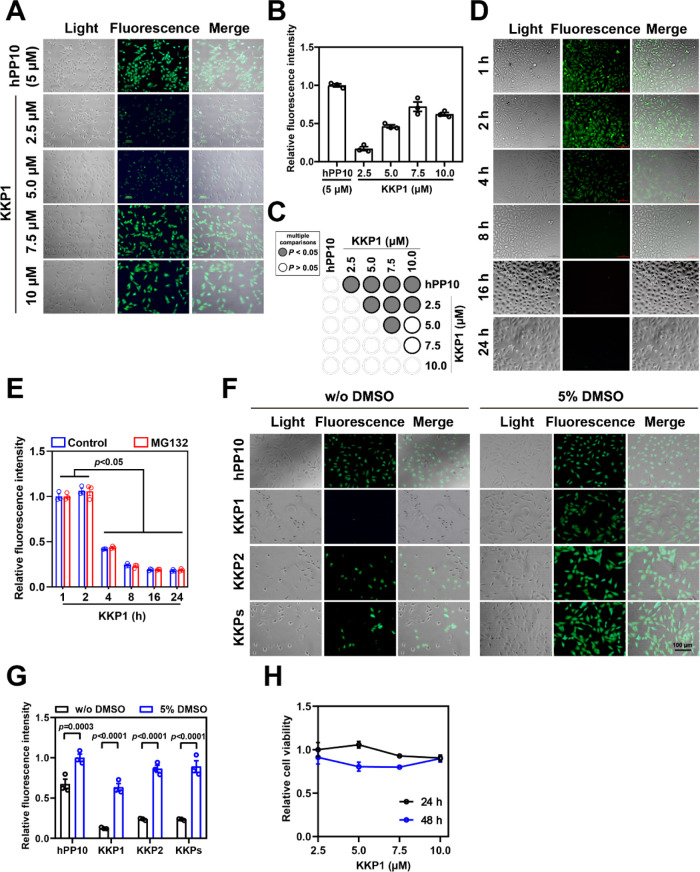
Figure 3.
Penetration efficiency of peptide KKP. (A) Fluorescence microscopy of the FITC-labeled peptide KKP penetration at the indicated peptide concentration; FITC-labeled hPP10 at 5 μM was used as the control. (B) Fluorescence intensity quantification of FITC-labeled KKP1 treated at the indicated peptide concentration corresponding to the fluorescence microscopy shown in (A). (C) Corresponding p value plot between data pairs presented in (B). ANOVA was used to compare the differences between the control and experimental values. (D) Fluorescence microscopy of FITC-labeled KKP1 at a 7.5 μM incubation with different time points. (E) Fluorescence intensity quantification of FITC-labeled KKP1 (7.5 μM) treated with different time points (with or without the MG132 treatment) corresponding to the fluorescence microscopy shown in (D). The value represents means ± SEM. The groups from KKP1 incubation for 1 and 2 h were compared with the 4, 8, 16, and 24 h groups. (F) Fluorescence microscopy of the FITC-labeled KKP peptide (7.5 μM) in HSC-T6 cells pretreated with or without 5% DMSO. (G) Fluorescence intensity quantification of the FITC-labeled KKP peptide in HSC-T6 cells pretreated with or without 5% DMSO. Comparisons were made between with or without 5% DMSO treatment using ANOVA. (H) The cell viability of HSC-T6 was examined by a CCK-8 test at the indicated concentration for 24 or 48 h.

