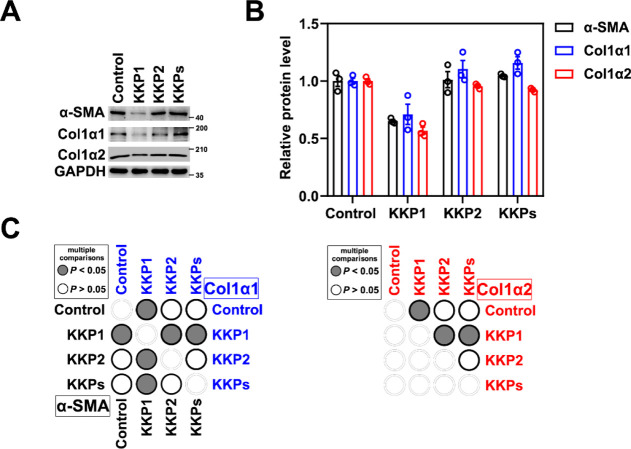
Figure 7.
Peptide KKP1 treatment attenuates fibrosis marker gene expression. (A) Western blot analysis of Col1α1, Col1α2, and α-SMA protein levels in the HSC-T6 cells incubated with KKP1, KKP2, and KKPs for 8 h. (B) Densitometric quantification of Col1α1, Col1α2, and α-SMA proteins in the blots shown in (B). The data in the graph are means ± SEM of three independent measurements. (C) Corresponding p-Value plot of the data pairs shown in (B).

