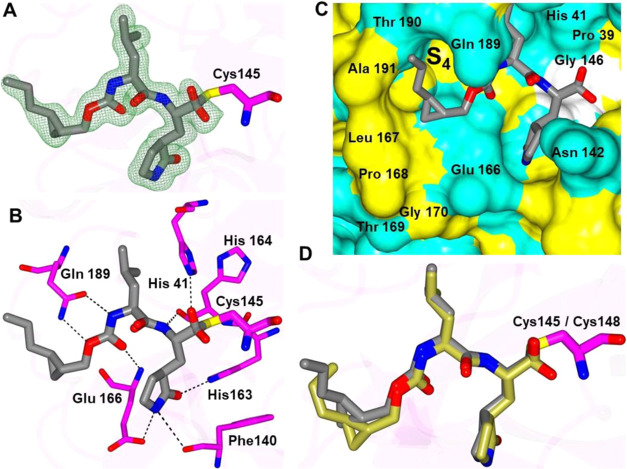
Figure 7.
Binding mode of inhibitor 13d to the SARS-CoV-2 3CLpro active site. Fo-Fc omit maps (green mesh) contoured at 3σ (A), hydrogen bond interactions (dashed lines) (B), surface representation showing the orientation of the inhibitors near the S4 subsite with neighboring residues colored yellow (nonpolar), cyan (polar), and white (weakly polar) (C), and superposition of 13c bound to MERS-CoV 3CLpro (gold) and 13d bound to SARS-CoV-2 3CLpro (gray) (D).

