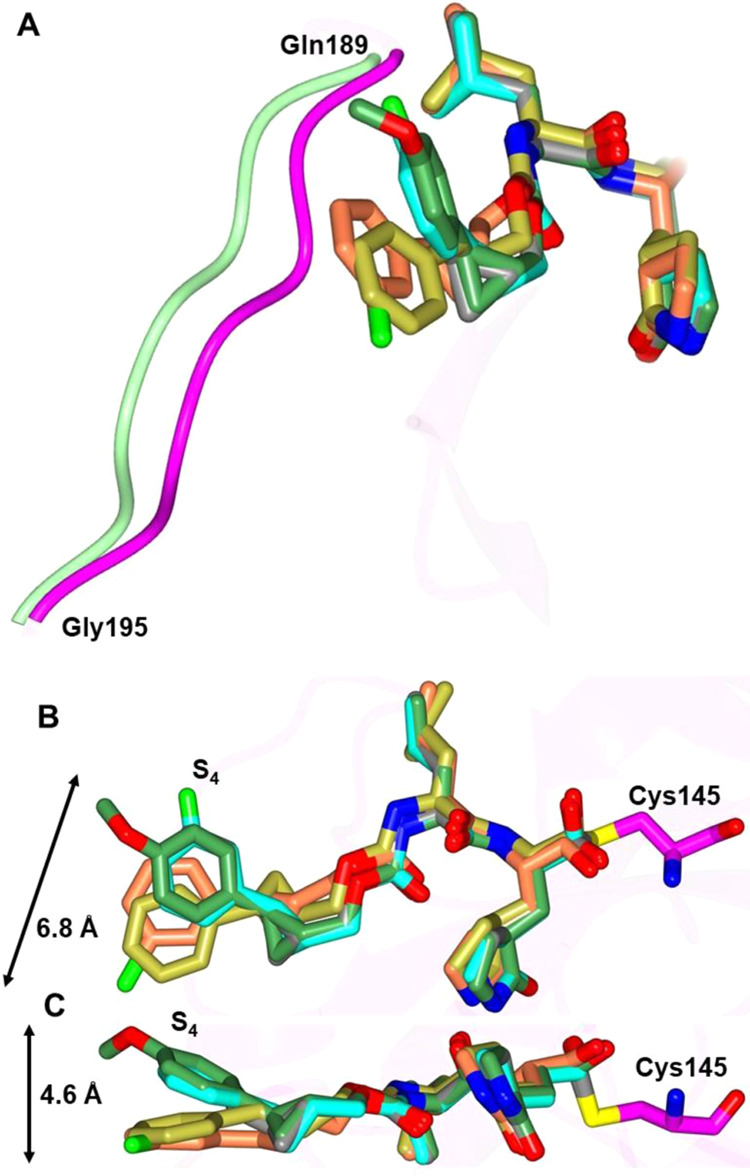
Figure 8.

Superposition of the SARS-CoV-2 3CLpro inhibitor bound structures. Superposition of 1c (gold), 5c (cyan), 6c (coral), 10d (green), and 13d (gray) showing the conformational differences in the loop spanning Gln 189-Gly 195 (A). Inhibitors 1c and 6c move the loop (green) away from the active site relative to 5c, 10d, and 13d (magenta). Two views showing the superposition of 1c (gold), 5c (cyan), 6c (coral), 10d (green), and 13d (gray) bound to SARS-CoV-2 3CLpro highlighting the conformational differences in S4 subsite (B, C). The range of motion for the inhibitors is noted by the arrows.
