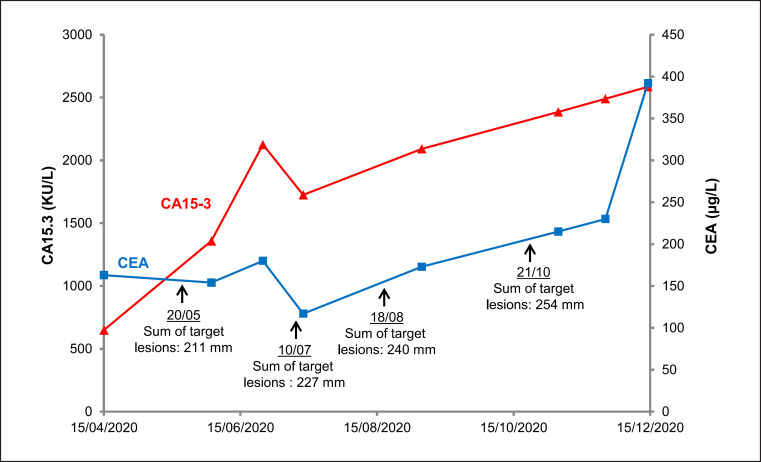
Fig. 2.
Serum tumor markers CEA and CA15.3 levels with respect to the sum of target lesions size during metastatic PCMC monitoring. CEA is expressed in µg/L (right axis) and CA15-3 in kU/L (left axis). Courses of tumor markers CEA and CA15.3 are presented by blue and red line, respectively. References values are <4.7 μg/L and <26.4 kU/L for CEA and CA15.3, respectively. Target lesions sizes were measured with CT scan.

