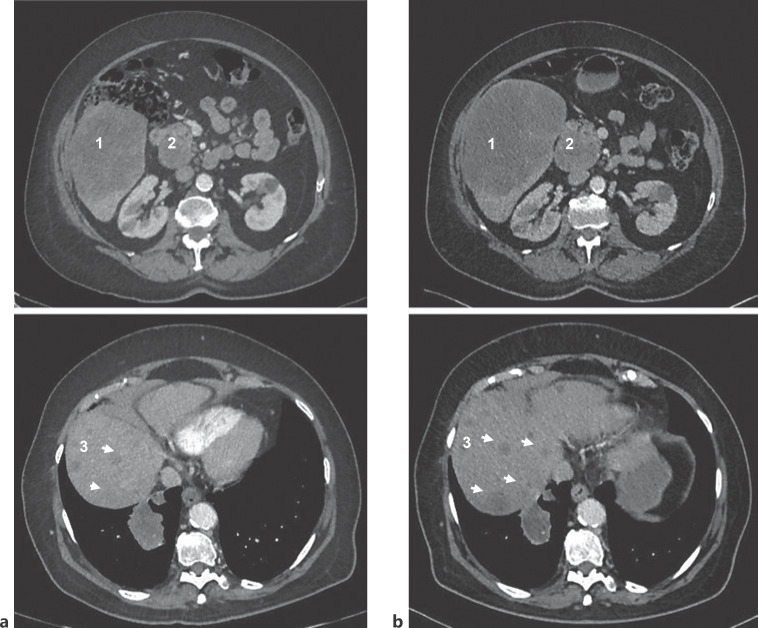
Fig. 3.
Two CT scans, repeated at an interval of about 3 months, show disease progression. a CT scan performed in July 2020. b CT scan performed in October 2020. CT scan slices enable to visualize hepatic lesion (identified by «1»), hilar lymphadenopathy (identified by «2»), and multiple hepatic lesions (identified by «3»). Comparison shows an increase of about 33% for hepatic lesion and 8% for hilar lymphadenopathy as well as enlargement of multiple hepatic lesions.

