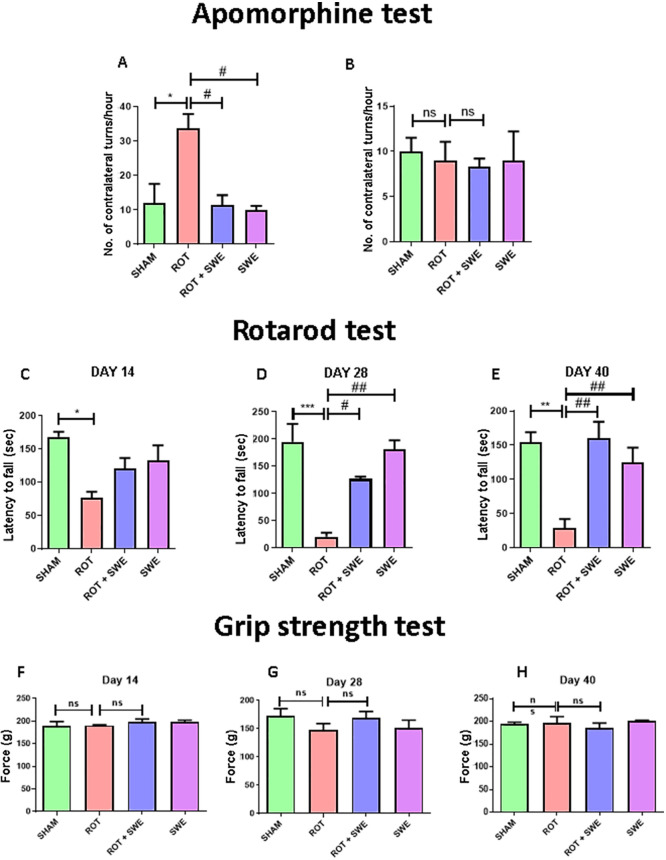
Figure 3.
Effect of SWE administration on rotenone-induced motor impairment. This figure represents (A, B) the number of contralateral and ipsilateral turns per h in the apomorphine-induced rotation test, (C–E) latency to fall (s) in the rotarod test, and (F–H) force applied (in g) by mice paws to grab the grid in a grip strength test. Data are expressed as mean ± SEM (n = 3). Statistical significance was compared using one-way ANOVA followed by Tukey’s post hoc test. *p < 0.05, **p < 0.01, ***p < 0.001 vs sham; #p < 0.05, ##p < 0.01 vs ROT (rotenone); ns presents no significant difference.

