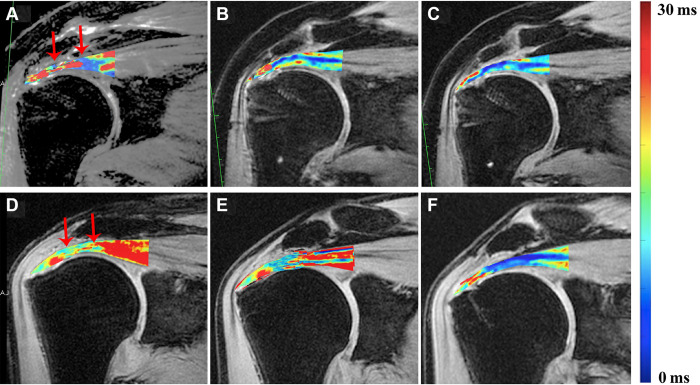
Figure 3.
Reformatted longitudinal ultrashort echo time–T2* images from (top row, A-C) a 52-year-old male patient from the suture-bridge group and (bottom row, D-F) a 49-year-old male patient from the single-row group at different follow-up time points: (A, D) 3 months, (B, E) 6 months, and (C, F) 12 months. The range of interest (ROI) of the distal region is directly over the medial-row anchor, and the ROI of the proximal region is directly over the humeral head. High T2* values are depicted as red and low T2* values as blue. The region between the red arrows mean the proximal region of repaired tendon.

