
Figure 4.
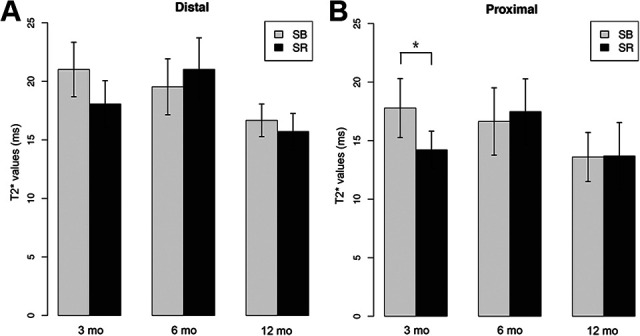
Comparison between the suture-bridge (SB) and single-row (SR) groups of mean longitudinal T2* values for the (A) distal and (B) proximal regions. Error bars represent SDs. *P < .05.
Official websites use .gov
A
.gov website belongs to an official
government organization in the United States.
Secure .gov websites use HTTPS
A lock (
) or https:// means you've safely
connected to the .gov website. Share sensitive
information only on official, secure websites.
Comparison between the suture-bridge (SB) and single-row (SR) groups of mean longitudinal T2* values for the (A) distal and (B) proximal regions. Error bars represent SDs. *P < .05.