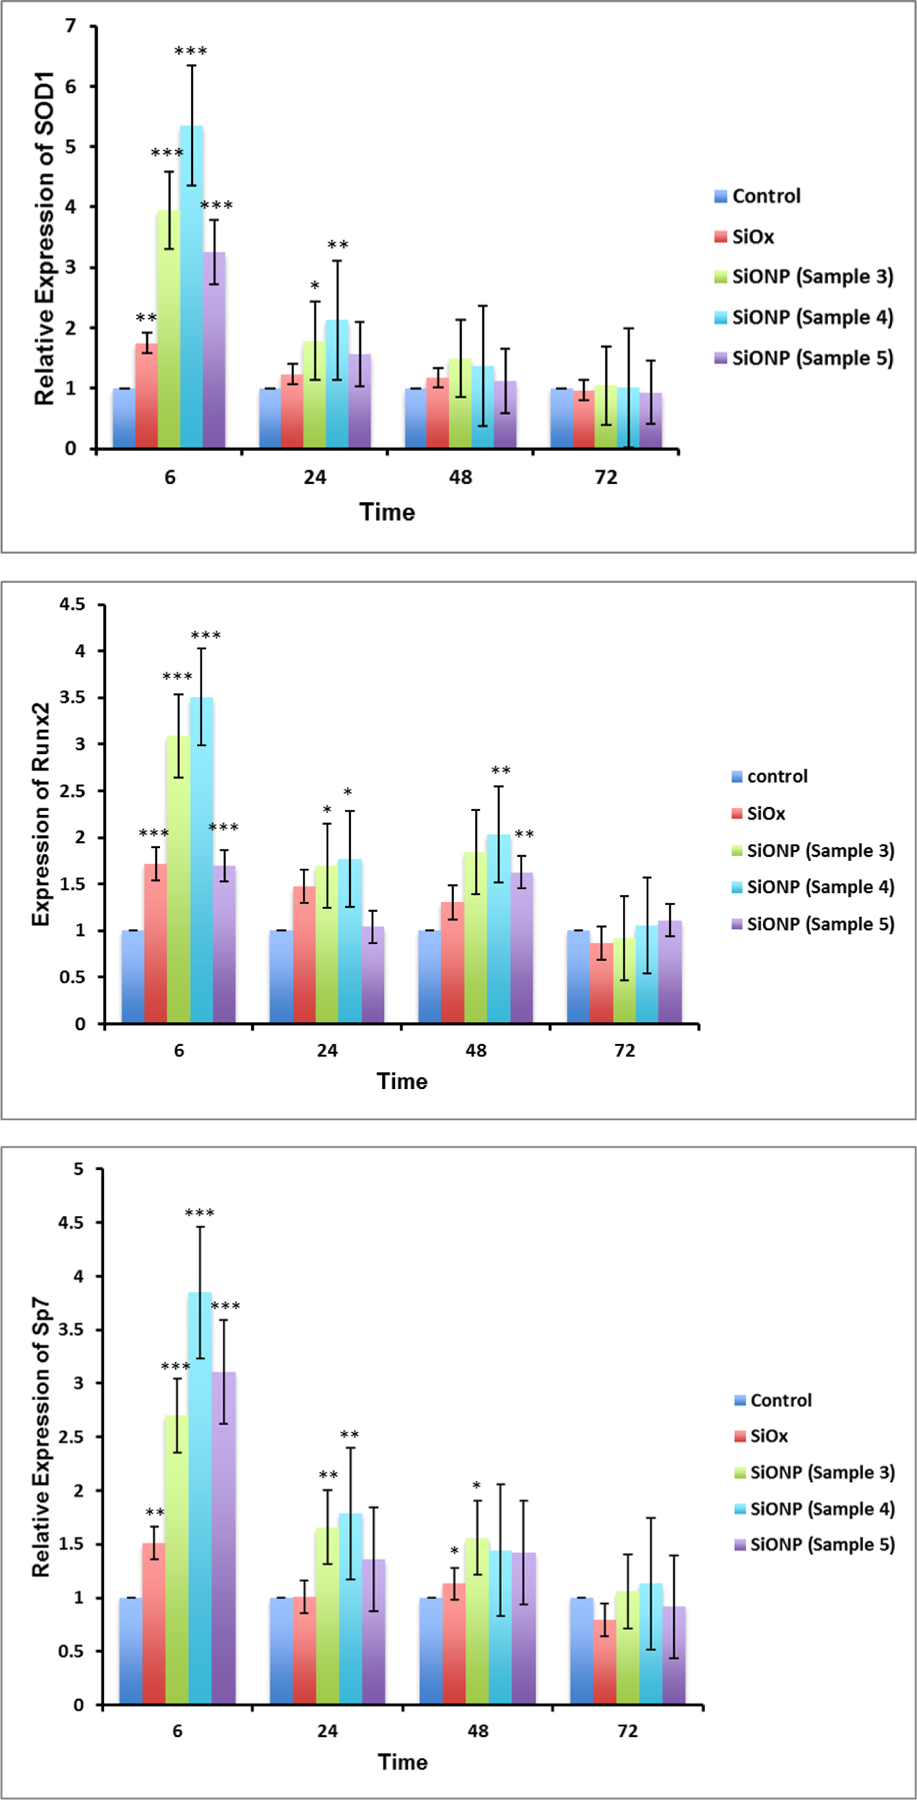
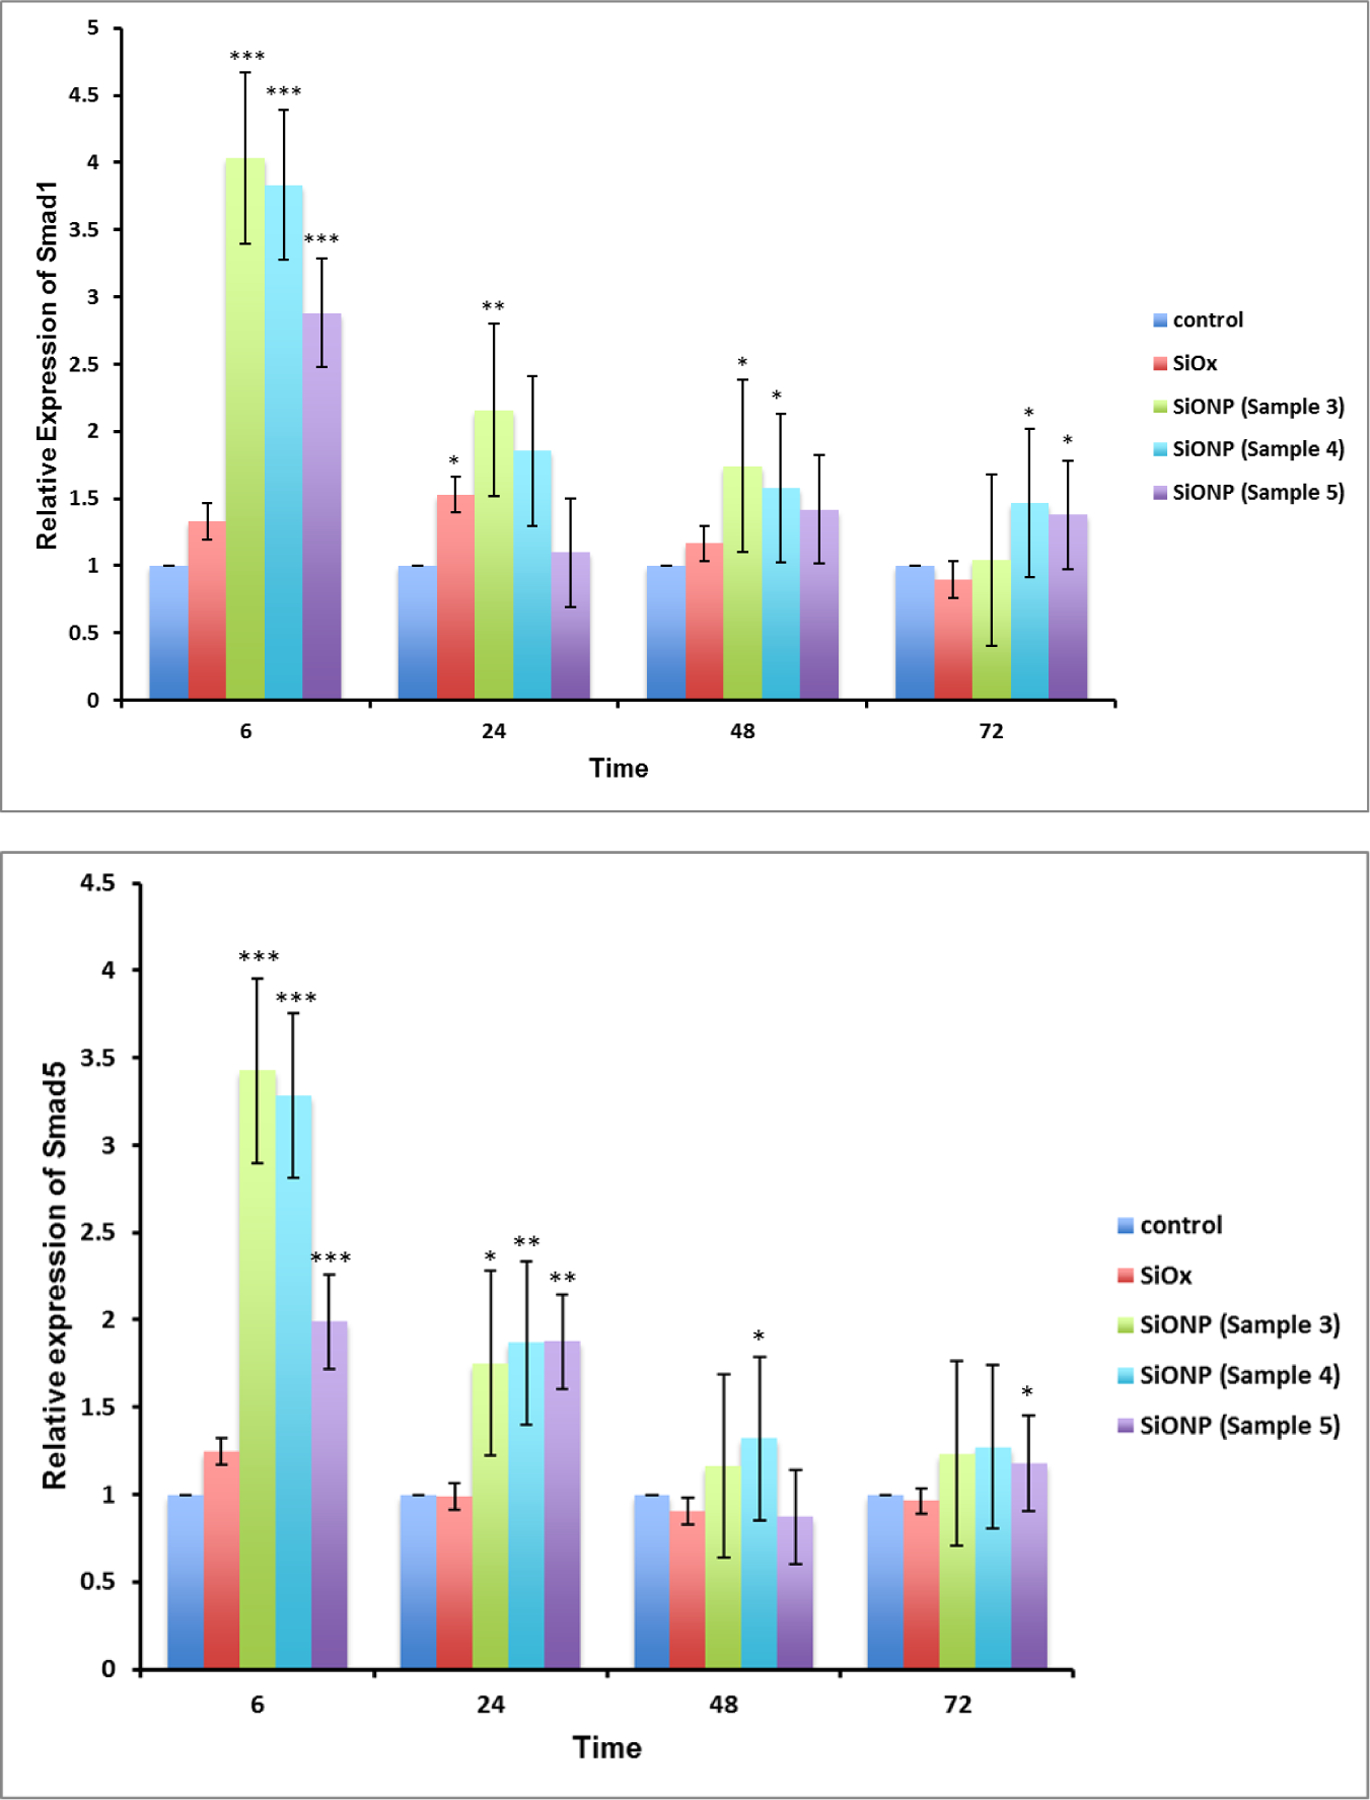
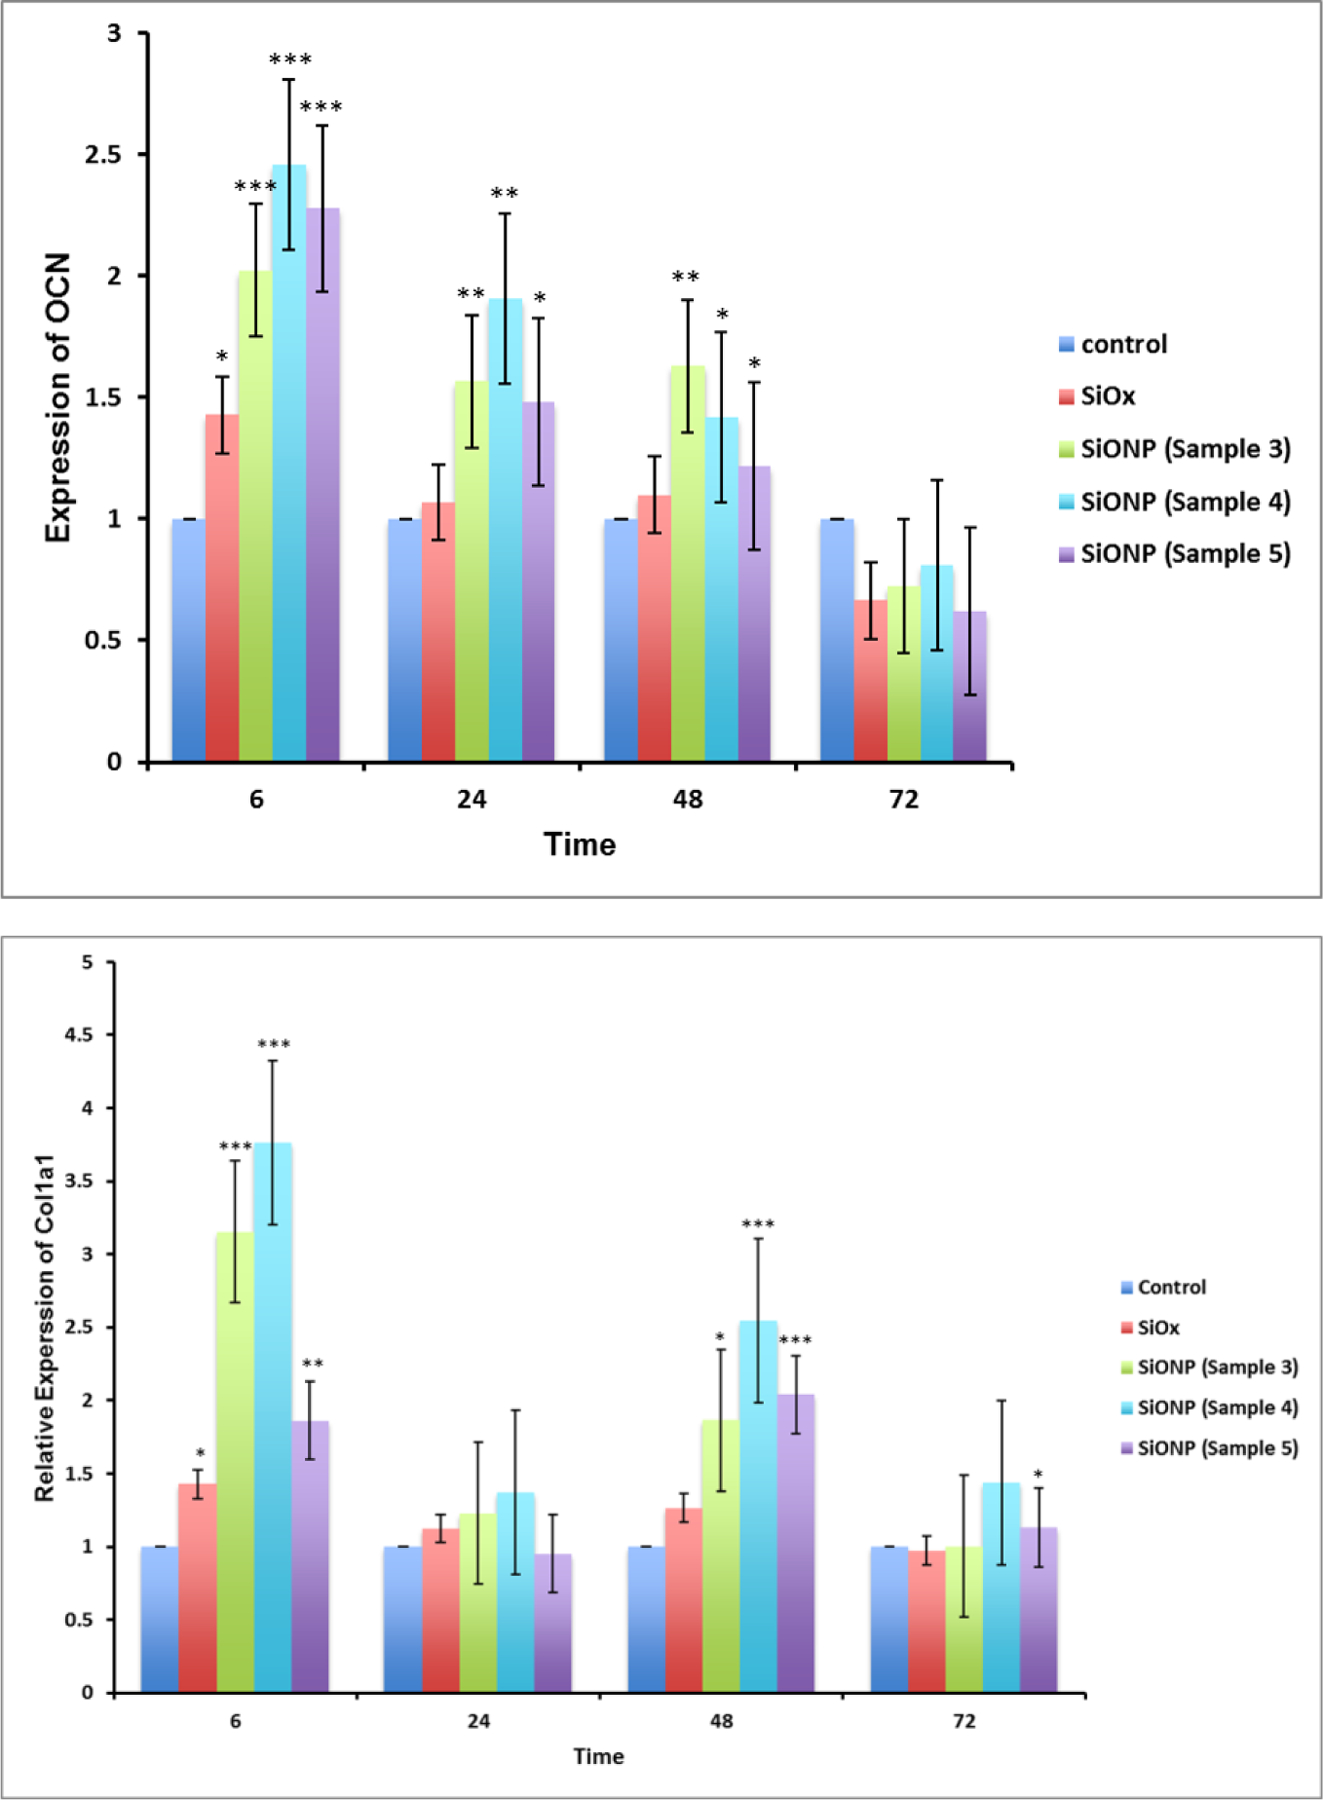
Figure 5.


SiONP surfaces showed an enhanced expression of (a) SOD1 (b) Runx2 (c) Sp7 (d) Smad1 (e) Smad5 (f) OCN and (g) Col(Ⅰ)-α1 osteogenic markers for MC3T3 cells when compared to control surfaces. Maximal enhancement was observed when both the N and O were present in adequate quantities in the layer (sample 4). Moreover, MC3T3 cells showed maximum enhancement to the SiONP surface at the very initial time point (6h).
