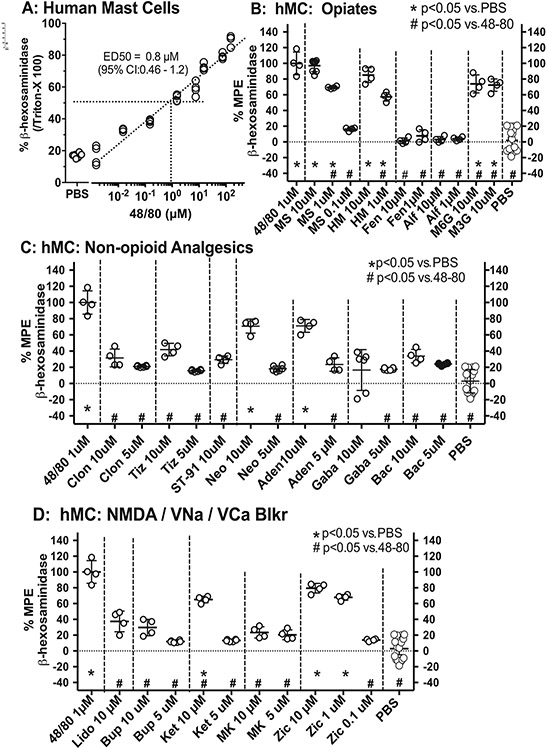
Fig. 4.
A: Scattergrams showing concentration-effect line for 48/80 plotting the ß-hexoseamindiase release in human mast cell (hMC) cultures evoked by 48/80, where release is expressed as a percent of the total release produced by Triton X vs. log 48/80 concentrations. The release of ß-hexoseamindiase in hMC produced by B: Opiates; C: non-opioid analgesics; D: NMDA and voltage gated sodium and calcium channel antagonists. Release is expressed as the percent of the maximum possible effect (%MPE), where MPE is the drug-evoked release by PBS divided by the difference between the release-evoked 48/80 and PBS. One-way ANOVA with post hoc comparisons performed with Dunnett's. *: p < 0.05 compared with release evoked by PBS and #: p < 0.05 for release as compared to 48/80.

