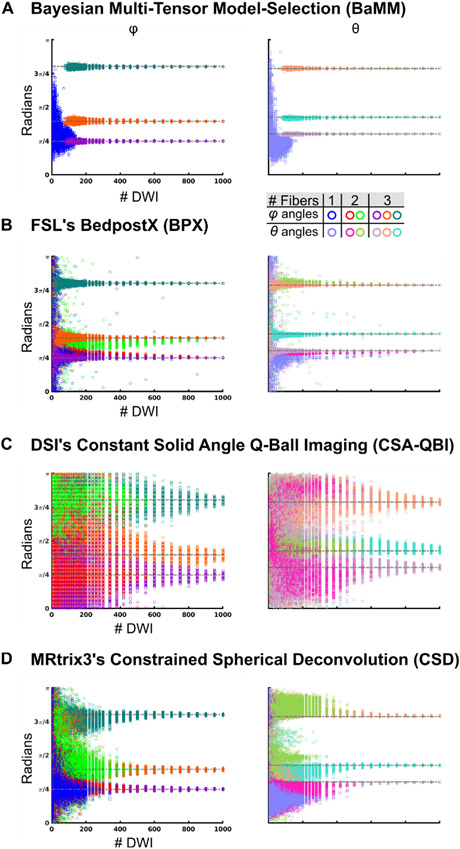
Fig. 5. Accuracy of diffusion measures in simulated three crossing tensor data.
The tensors were oriented such that they were perpendicular to each other. The tensors had weighting equal to 40%, 34%, and 26% of the signal. Rician noise was added for an SNR = 50. (A) φ/θ angle estimations by Bayesian Multi-tensor Model-selection (BaMM). Open circles represent the results obtained by repeated permutation sampling. Same color legend for all data panels. Permutations that resulted in a single fiber direction are plotted in blue/sky blue (φ/θ). Permutations that resulted in two fibers are plotted in red/pink (φ/θ) and green/olive (φ/θ). Permutations that resulted in three fibers are plotted in purple/lilac (φ/θ), orange/salmon (φ/θ), and teal/cyan (φ/θ). (B) FSL’s BedpostX (BPX). (C) Constant Solid Angle Q-Ball Imaging (CSA-QBI). (D) Constrained Spherical Deconvolution (CSD).

